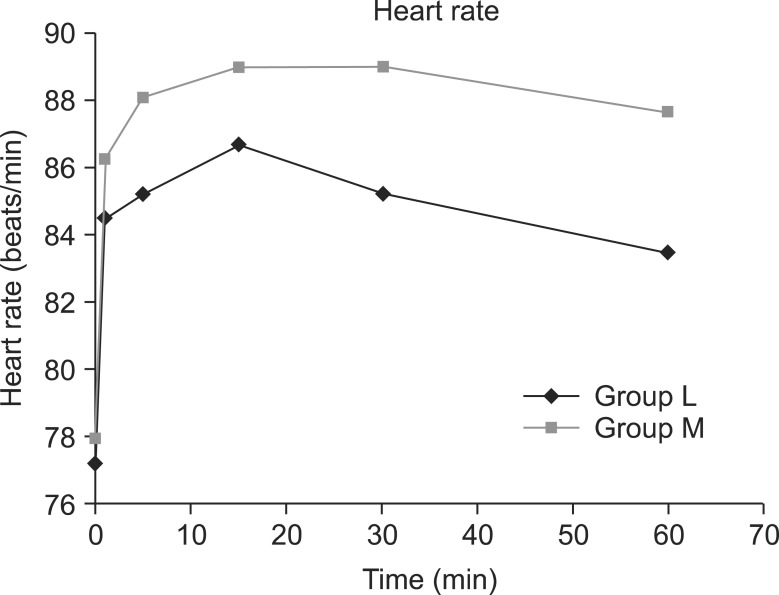
Fig. 4.
Changes in heart rate between groups L and M. Each bar represents the mean ± SD. Group L (n = 50) received spinal anesthesia that consisted of hyperbaric lidocaine (5%, 75 mg) and normal saline. Group M (n = 50) received spinal anesthesia that consisted of hyperbaric lidocaine (5%, 75 mg) and meperidine (0.2 mg/kg). There were no significant differences between group L and M.

