
Figure 4.
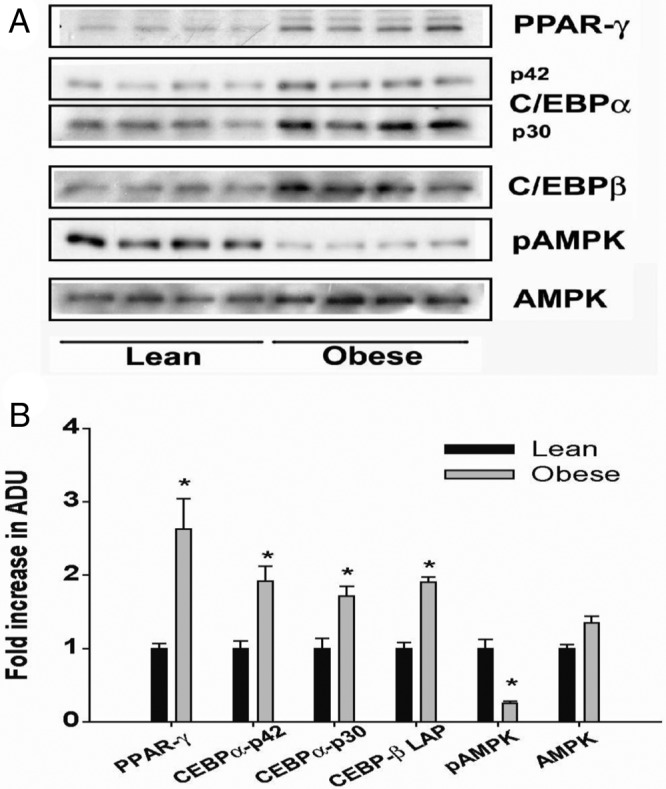
Immunoblot analysis (A) and densitometric quantification (B) of adipogenesis-related proteins in total lysates from WAT of lean and OB dams at PND21 (n = 4 pools per group; see Supplemental Table 1 for litters). Statistical differences were determined using Student's t test. *, Significance, P < .05. ADU, arbitrary density units.