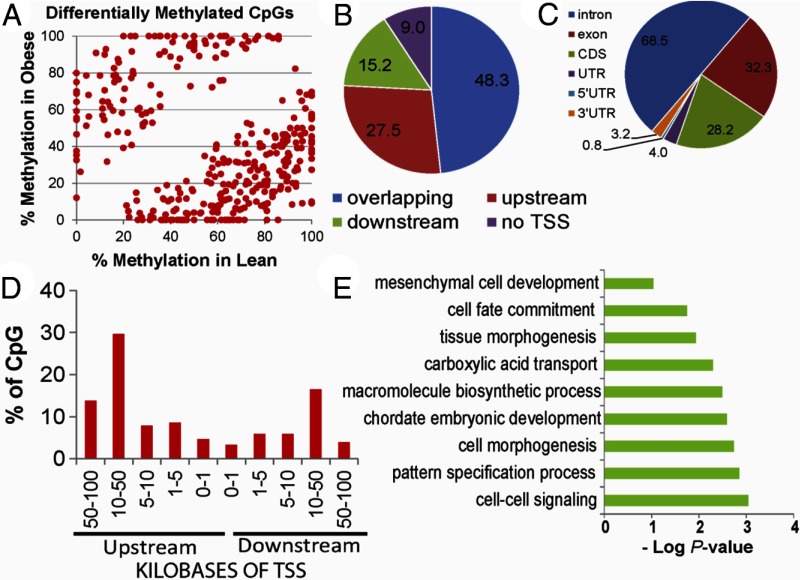
Figure 6.
A, Scatter plot of 356 CpG sites showing differential methylation (DMS, P < .0005; Δme ≥10% between OB and lean offspring). Percent methylation at each CpG site was assessed using RRBS. Genomic localization of intergenic DMS (panel B), intragenic DMS (panel C), and distance from closest transcription start sites (panel D). E, Enrichment of GO biological processes in differentially methylated sites using GoRilla. GO terms are plotted against negative log of corrected P values. UTR, untranslated region.

