Figure 2.
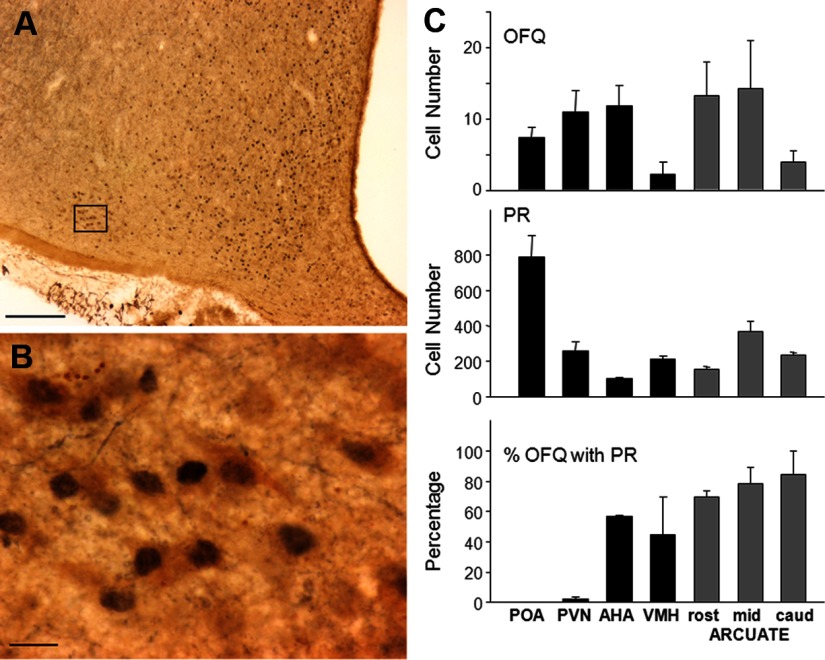
(A and B) Photomicrographs of OFQ immunoreactive cells (brown cytoplasm) and PR (blue-black nuclei) in the ovine ARC. Box in A depicts position of neurons shown at larger magnification in B. Magnification bars, 200 μm (A) and 25 μm (B). (C) Mean (±SEM, n = 3) OFQ-positive cell number (top graph), PR-containing cell number (middle graph), and percentage of OFQ neurons also containing PR (bottom graph) in the POA, PVN, AHA, VMH, and 3 regions (rost, rostral; mid, middle; caud, caudal) of the ARC (gray bars).

