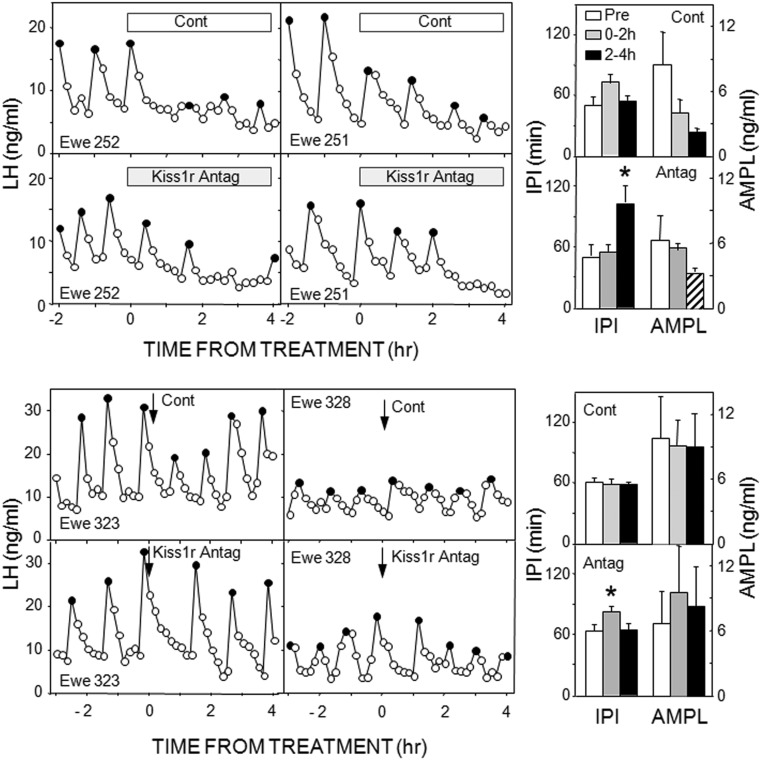
Figure 1.
Left panels, Top panels depict LH pulse patterns in two ewes receiving empty (open bar) and Kiss1r antagonist-containing (shaded bar) microimplants into the ARC. Bottom panels present LH pulse patterns in two ewes receiving microinjections (arrows) of saline (Cont) and 2 nmol Kiss1r antagonist into the ARC. Solid circles depict peaks of identified LH pulses. Right panels, Mean (± SEM) LH IPIs (left) and AMPLs (right) in response to control and Kiss1r antagonist treatments into the ARC; top two panels are from microimplants and bottom two from microinjections. Open bars, Pretreatment values; shaded bars, values for 0–2 hours after microimplantation or microinjection; black bars, values for 2–4 hours after microimplantation or microinjection; striped bar, not analyzed due to low animal numbers. *, P < .05 vs pretreatment values.

