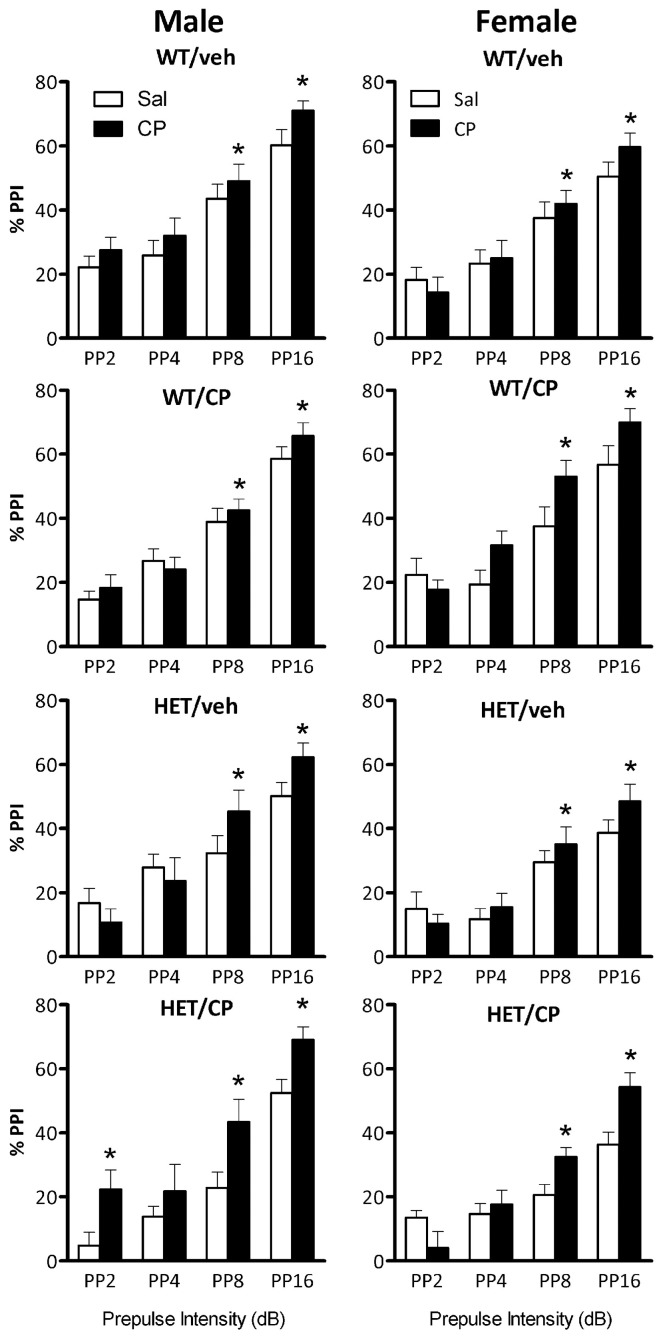
Figure 5.
Percentage prepulse inhibition (PPI) expressed per prepulse intensity in the four treatment groups: WT/veh, WT/CP, HET/veh, and HET/CP in both sexes. All groups were administered saline (Sal; open bars) or 0.4 mg/kg CP55,940 (CP; black bars) PP2, PP4, PP8, and PP16 indicate prepulse intensities of 2, 4, 8, and 16 dB over the 70 dB background with a 100 ms interstimulus interval. Data are mean ± SEM. *P < 0.05 for difference with acute saline treatment based on ANOVA main effect (PP8 and PP16) or CP × genotype × pre-treatment interaction and pair-wise comparison (PP2).

