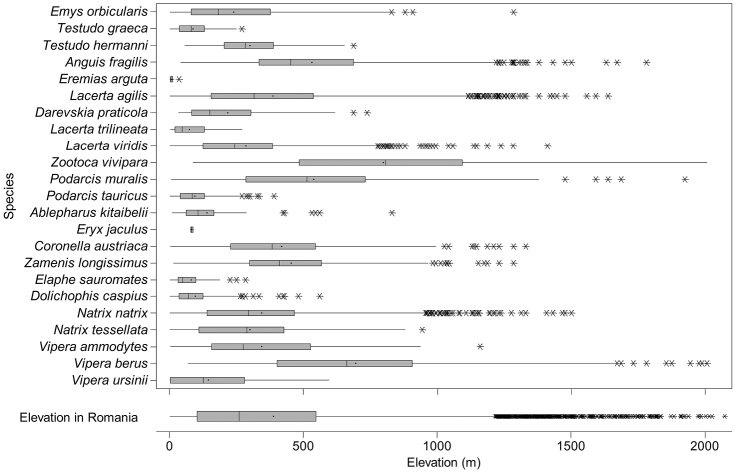
Figure 5.
The box and whisker plot of altitudinal distribution of reptile species in Romania. The boxes represent 25th–75th percentiles, upper and lower whiskers extends minimum and maximum data point within 1.5 box heights from the bottom and from the top of the boxes. Asterisks indicate outliers, lines and dots inside the boxes denote medians and means, respectively.

