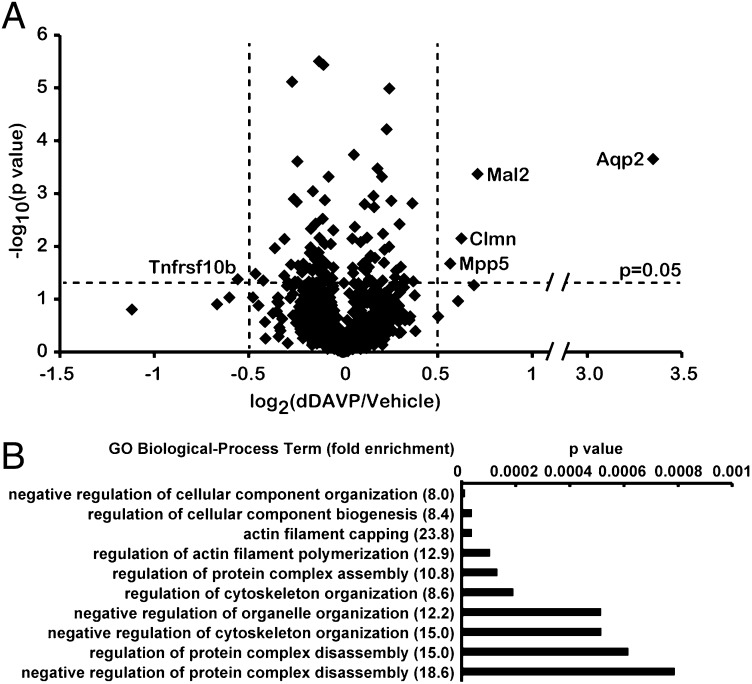
Fig. 3.
Bioinformatic analysis of dDAVP-regulated apical membrane proteins. (A) Volcano plot summary of SILAC-based quantification of 1,028 apical plasma membrane proteins (n = 3). Log2(dDAVP/vehicle), base 2 logarithmic value of protein abundance ratio (dDAVP vs. vehicle). Log10(P value), base 10 logarithmic value of P value of t test, log2(dDAVP/vehicle) vs. log2 (1). (B) GO Biological Process terms extracted for the 100 dDAVP-regulated proteins. The P values were obtained using Fisher’s exact test against all transcripts expressed in mpkCCD cells (4).

