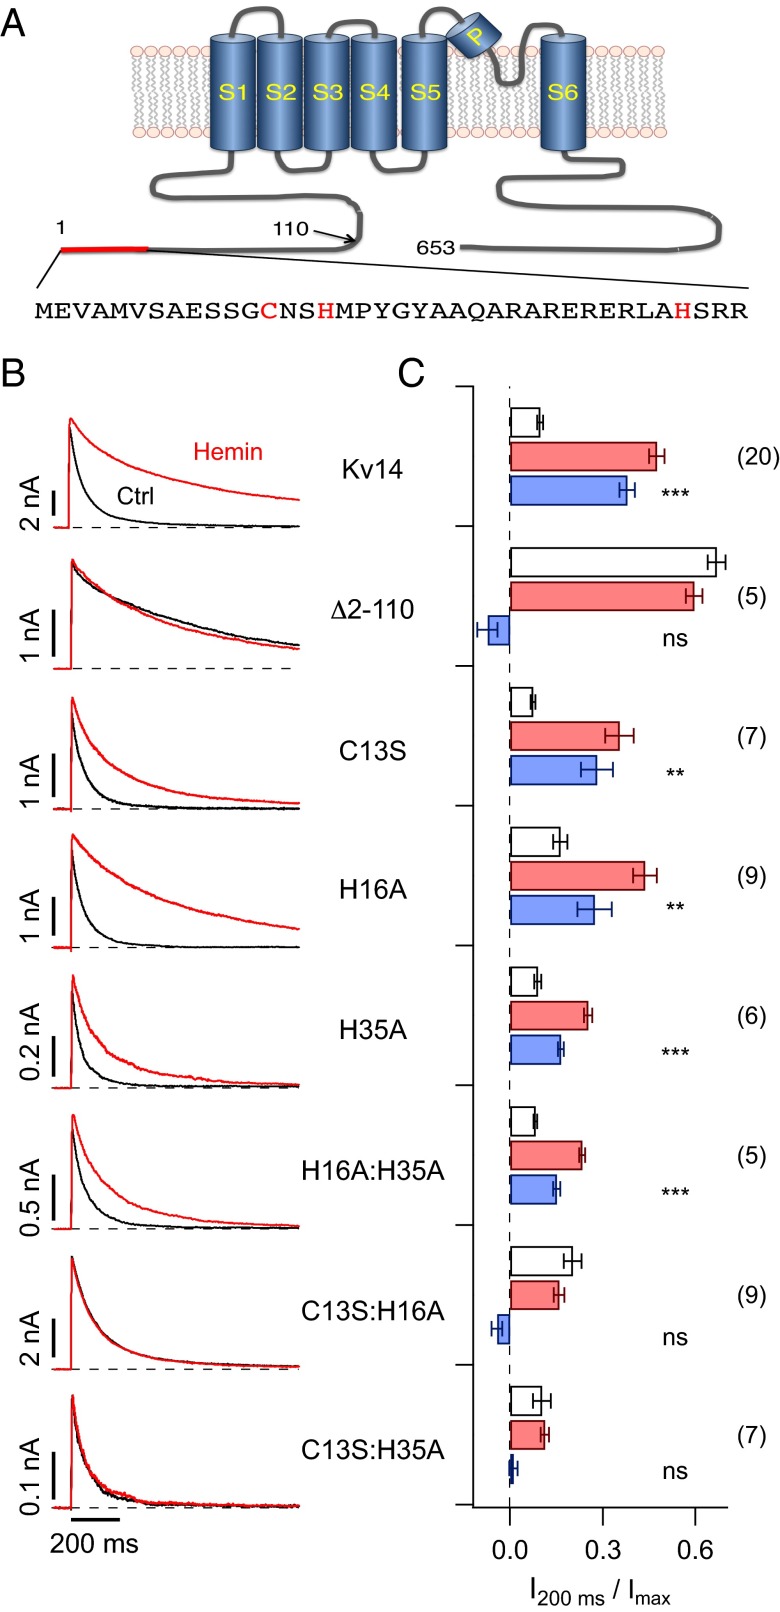
Fig. 2.
Mutagenesis of N-terminal inactivation domain. (A) Schematic presentation of the Kv1.4 protein comprising the cytosolic N and C termini, as well as the membrane-delimited 6TM domain (S1–S6). Residue numbers, based on rat Kv1.4, are indicated and the amino acid sequence corresponding to the red bar is shown below, highlighting C13, H16, and H35. (B) Inside-out patch-clamp recordings on depolarization to 40 mV for the indicated channel constructs before (black) and about 200 s after application of 200 nM hemin (red). (C) Current after 200 ms of the depolarization onset relative to the peak current for the indicated channel constructs before (white bars) and after application of hemin (red bars) from experiments as in B. Blue bars indicate the loss of inactivation induced by hemin. The numbers of independent measurements are given in parentheses. Statistical indicators reflect a two-sided paired t test, followed by Bonferroni correction, testing for a change of inactivation induced by hemin: ns, not significant; P > 0.05; **P < 0.01; ***P < 0.001.

