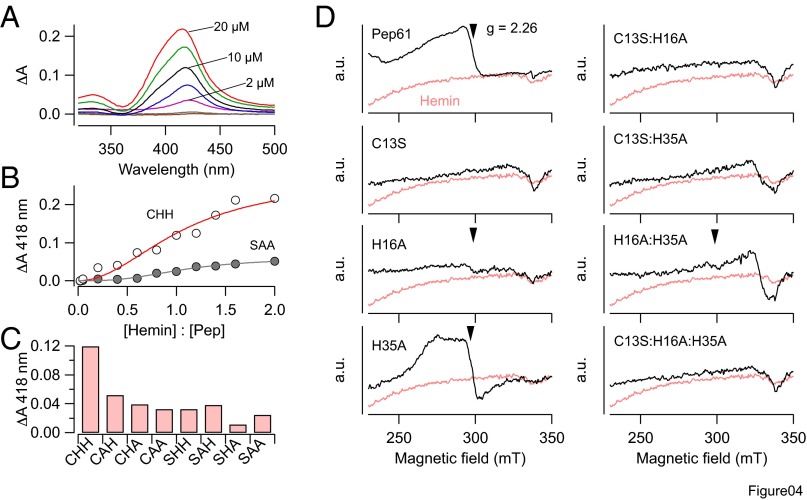
Fig. 4.
Hemin binding to Pep61. (A) UV-vis difference spectra using 10 µM Pep61 and increasing concentration of hemin. The black trace is for a 1:1 ratio. Experiments were performed in the presence of 2 mM GSH. (B) Titration curve for Pep61 (open circles) at 418 nm yielding a half-maximal binding at a hemin:peptide ratio of 1.08 and a Hill coefficient of 2. For mutant Pep-C13S:H16A:H35A (SAA, filled symbols) only a weak increase in absorbance was observed. (C) Absorbance change at 418 nm for 10 µM of the indicated peptides and 10 µM hemin. CHH refers to the WT signifying C13, H16, and H35. (D) Electron paramagnetic resonance spectra for 210 µM hemin (pink in all panels) and hemin plus 280 µM of the indicated peptides. Arrows mark the g factors at 2.26, which are part of rhombic signals typical for axial ligation of the low-spin hemin iron. From the full spectra, the following sets of g factors were determined: Pep61, [2.46, 2.26, 1.91]; Pep61-H35A, [2.47, 2.27, 1.90].

