Fig. 2.
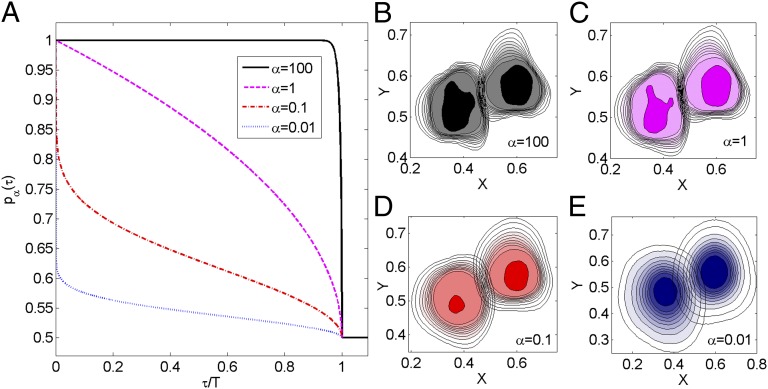
Relation between the degree of stigmergy and the animal occupation probability. The animal response function to the encounter of conspecific marks is depicted in A, with the resulting spatial pattern of two representative neighboring individuals in the population shown in B. (A) Response functions  for different values of the degree of stigmergy α as a function of τ, the time in the past when an encountered (foreign) mark was deposited. (B–E) Utilization distributions (i.e., time-integrated position distributions) of two neighbors with spatial coordinates in arbitrary units for different degrees of stigmergy α. The competition parameter Z (see text) has been set equal to 32 in all three cases. The left and right neighboring individuals shown here are selected from a population composed of 16 animals, with simulations integrated over a time equal to 2.5T, and with their utilization distributions colored purple and red, respectively, in the corresponding four panels displayed in SI Appendix, Fig. S1. The fraction of time an individual has occupied a lattice site is given by the contour level values (not shown), ranging from 0.008 for the innermost ones to 10−4 for the outermost ones. In sequentially observing B through E, the spacing between contours increases, indicating a decrease in the steepness of the utilization distribution at the boundaries. In E, the probability of occupying a site is never more than 0.008, so there is one less contour than in B–D, and the innermost contour is at height 0.004.

