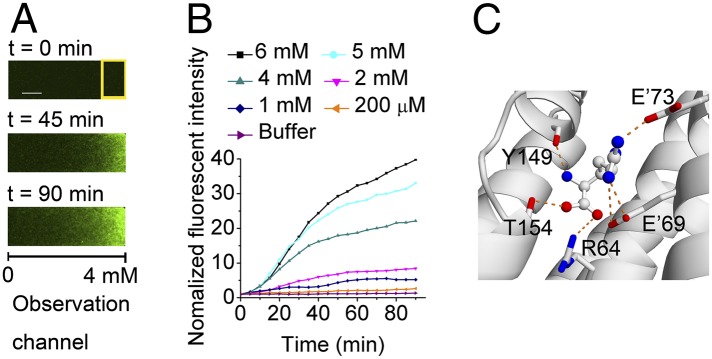
Fig. 6.

Rational design of Tar to chemotaxis to Arg. (A) Responses of the mutant strain R69′ER73′E to a gradient of Arg recorded by fluorescence microscopic images at different times (Scale bar, 100 μm.). The Arg gradient is from 0 to 4 mM across the observation channel. The response is characterized by the fluorescence intensity in the analysis region (yellow rectangle) of the observation channel. (B) Responses of the mutant strain R69′ER73′E to different Arg gradients. The concentrations given are the maximum Arg concentrations at the right end of the observation channel (the Arg concentration at the left end is 0 mM). The fluorescent intensities in the analysis region relative to the initial intensity were plotted as a function of time for different Arg gradients. (C) Interactions of Arg with the binding pocket of Tar variant R69′ER73′E predicted by molecular docking.
