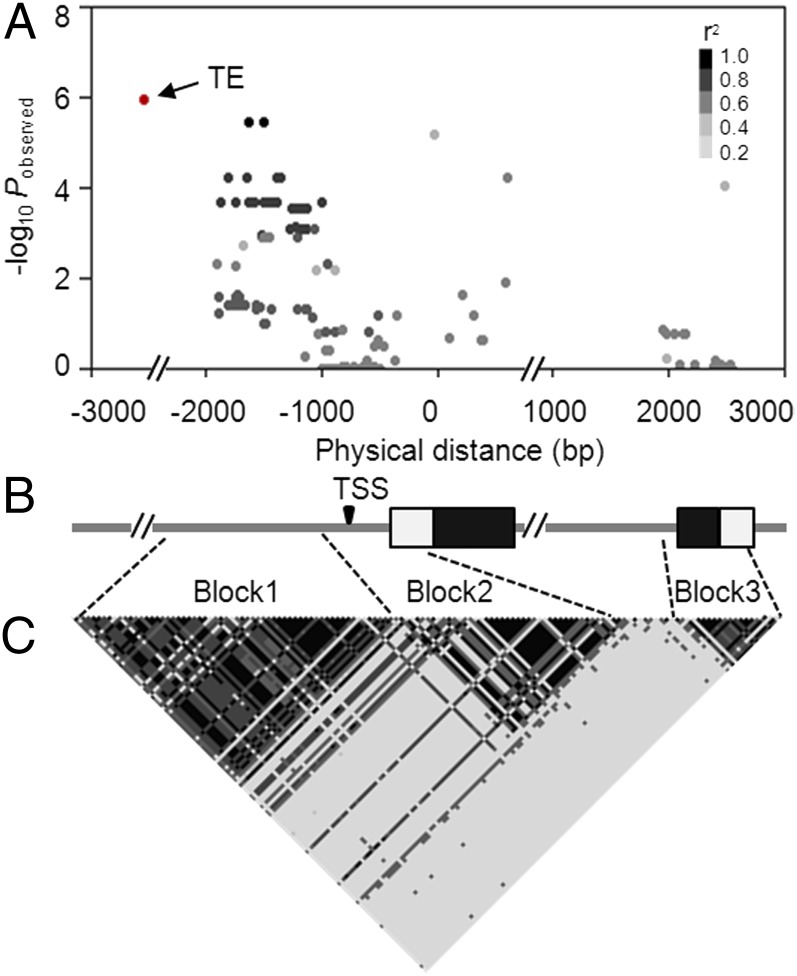
Fig. 1.
ZmCCT-based association mapping and LD analysis of 180 diverse maize lines. (A) Associations between polymorphic sites within the ZmCCT locus (MAF ≥0.05) and APR. Each dot represents a polymorphic site, and the color reflects the level of LD (r2) with the TE (except for the TE, which is red). (B) Structure of the ZmCCT locus. Black rectangles represent exons, and white rectangles represent UTRs. The transcription start site (TSS) is indicated. (C) The pattern of LD for all polymorphic sites within the ZmCCT locus. All polymorphic sites (MAF ≥0.05) excluding the TE were used.

