Fig. 4.
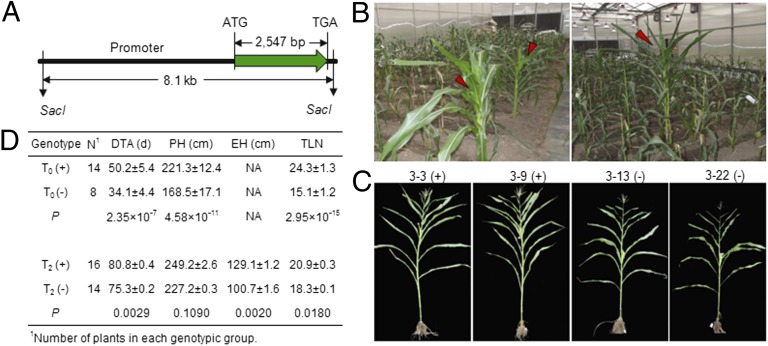
Functional validation of ZmCCT via transformation. (A) The DNA fragment used for the ZmCCT complementation test is shown. (B) The greenhouse performance of T0 transgenic plants. Red arrows indicate transgenic plants. (C) The greenhouse performance of T2 transgenic plants. Transgenic plants and sibling controls are indicated by (+) and (−), respectively. (D) Comparison between transgenic lines and controls in T0 and T2 generations under long-day greenhouse conditions. DTA, days to anthesis (for T0 plants, from the date of transplantation to anthesis); EH, ear height; PH, plant height; TLN, total leaf number. Data are shown as mean ± SE.

