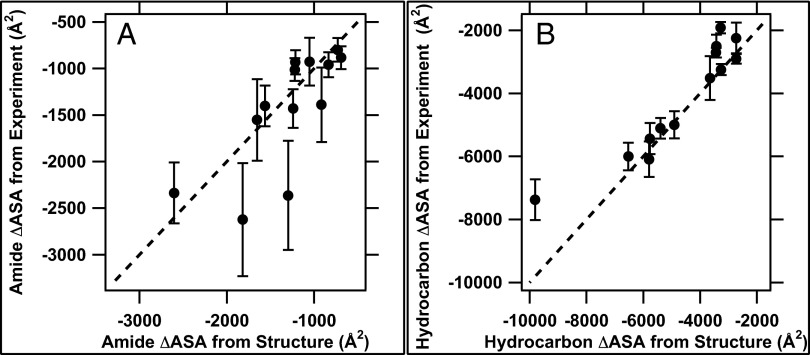
Fig. 1.
Comparison of amide (A) and hydrocarbon (B) ΔASA values for U → F from analysis of experimental data (using Eqs. 1 and 2) with values calculated from structural data for F and an extended-chain model for U (Table 2). The lines represent equality of experimental and structural values. Fig. S1 compares experimental and structural values for the sum of amide and hydrocarbon ΔASA for U → F.

