Fig. 1.
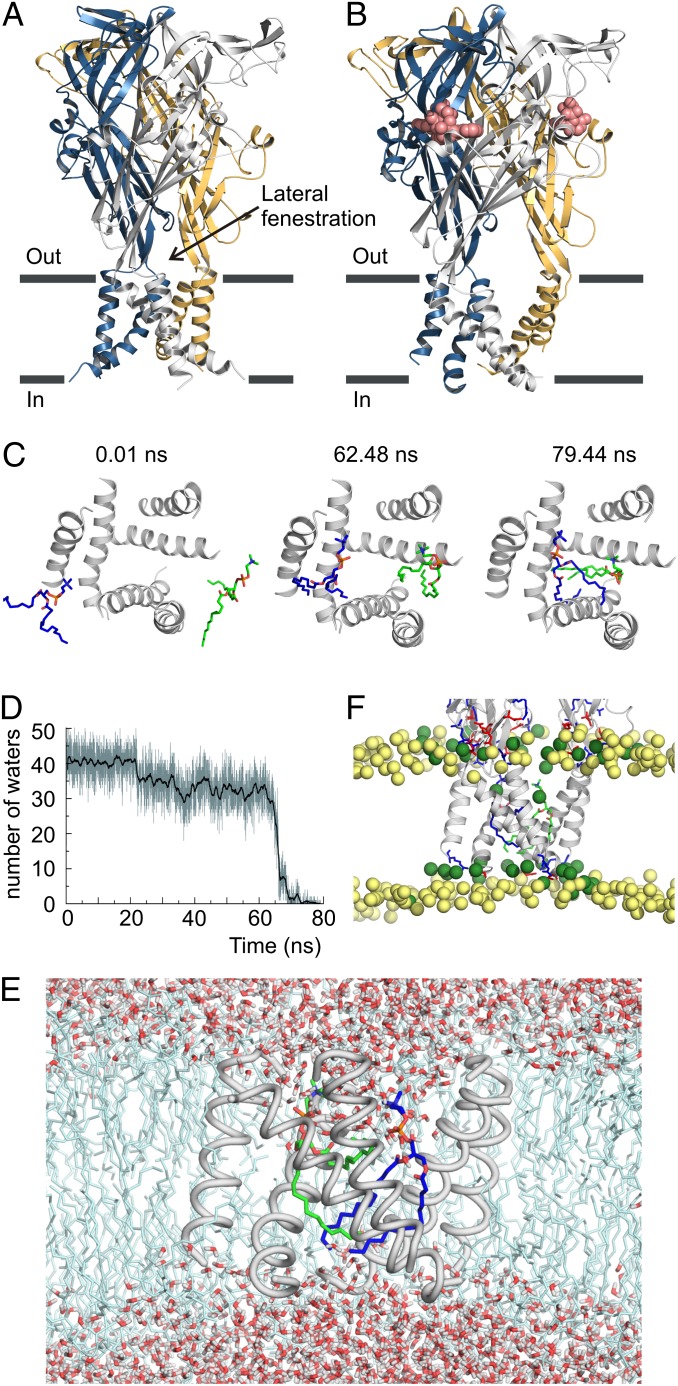
MD simulations of the ATP-bound zfP2X4 structure in a membrane environment. (A) Backbone ribbon representation of the X-ray structure of apo zfP2X4 receptor viewed parallel to the membrane with individual subunits colored blue, gold, and gray. (B) Backbone ribbon representation of the X-ray structure of ATP-bound zfP2X4 receptor. ATP is shown as red spheres. (C) Snapshots of the TM domain viewed from the extracellular side at various time points during the restrained MD simulation in a DMPC bilayer. TM helices are shown as gray backbone ribbon representations, and two DMPC lipid molecules are shown as stick representations with carbons in green and blue. Lipids began entering the intersubunit crevices at 62.48 ns and fully occupied the ion conduction pore at 79.44 ns. (D) Plot showing the number of water molecules within a 13-Å–deep section of the pore spanning residues A344–I355. (E) Snapshot of the MD simulation at 79.44 ns with water molecules and lipids shown. Note the absence of water molecules in the section spanning residues A344–I355. (F) Snapshot of the TM domain viewed parallel to the membrane at 79.44 ns in the MD simulation. Blue and red sticks on the protein represent positively and negatively charged residues, respectively. Yellow spheres are phosphorous atoms of bulk lipid molecules, and green spheres are phosphorous atoms of lipids around the receptor. In the lower leaflet, phosphates around the receptor are drawn toward the middle of the bilayer because of the hydrophobic mismatch between the TM domain and the bilayer.

