Fig. 8.
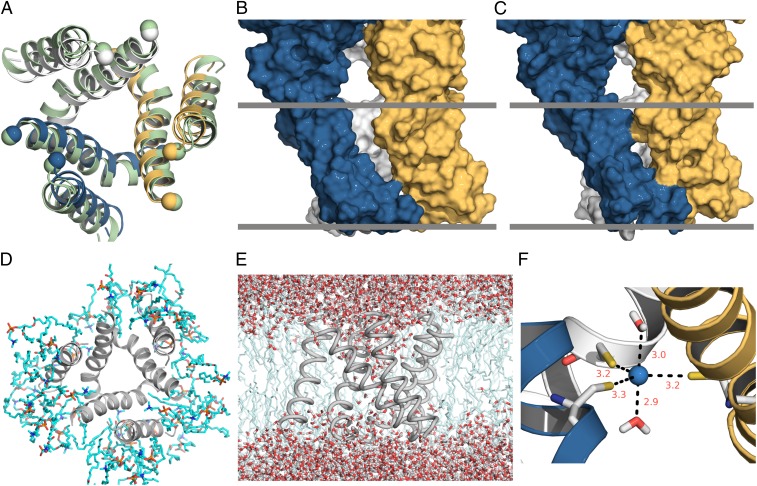
A structural model for the open state of P2X receptors. (A) Comparison of the TM domain between the X-ray structure for the ATP-bound zfP2X4 receptor (shown in light green) and the open-state model (with individual subunits colored in blue, gold, and gray) viewed from the external side of the membrane. The Cα atoms of the C terminus (residue G56) of TM1 and the N terminus (residue I335) of TM2 are shown as spheres. (B and C) Interfaces between adjacent subunits for the ATP-bound zfP2X4 receptor and the open-state model, respectively, depicted in a surface rendering. Hypothetical boundaries of the lipid bilayer are represented by gray bands. (D) Snapshot of the TM domain of the open-state model and its adjacent lipid molecules in the restrained MD simulation, viewed from the external side of the membrane. In contrast to observations in the simulations of the ATP-bound zfP2X4 receptor, no lipid molecules entered the pore in simulations of the open-state model. (E) Continuous water chain in the pore of the model. (F) Cd2+ coordination by the L351C trimer and two water molecules.

