Fig. 3.
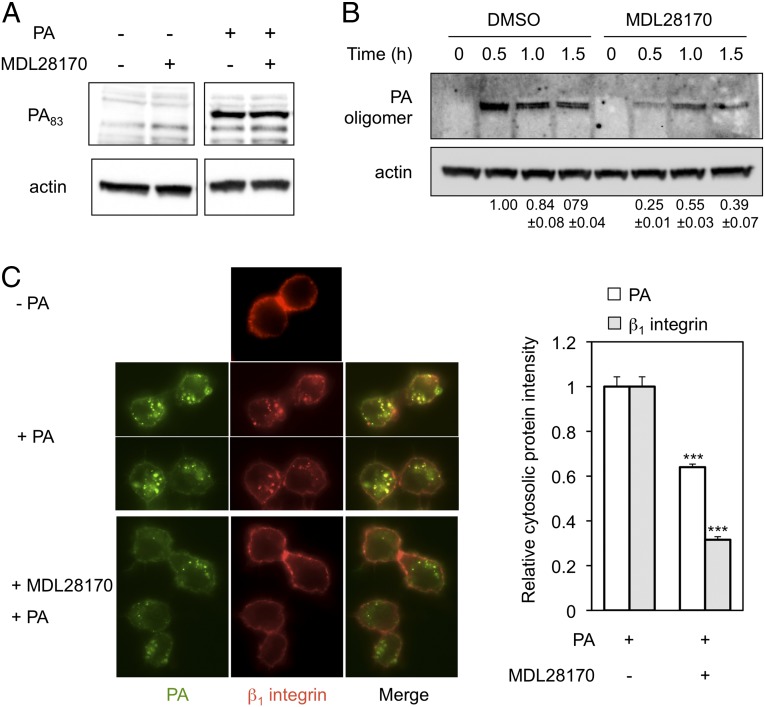
Effect of calpain inhibition on PA internalization. (A and B) RAW264.7 cells were incubated with 80 µM MDL28170 or DMSO control for 1 h. The cells then were exposed to 0.5 µg/mL PA and maintained at 4 °C for 1 h for binding assays (A) or at 37 °C for the indicated time for internalization assays (B). Cell lysates were analyzed by Western blotting using anti-PA antibody as described in Materials and Methods. The SDS-resistant PA oligomer signal was quantified by normalization against actin, and the resulting value was compared with the signal obtained from DMSO-treated cells at time point 0.5 h (which was assigned a value of 1.0). The mean ± SD for values obtained in three independent experiments are shown below the lanes in the Western blot in B. (C) Immunofluorescence analysis of cellular localization of PA and β1 integrin during PA internalization. RAW264.7 cells were preincubated with or without 80 µM MDL28170 for 1 h, followed by exposure to Alexa-Fluor 488–labeled PA in the presence of 0.5 µg/mL anti–β1 integrin-APC (HMβ1–1) antibody at 37 °C for 20 min. (Left) The cellular localization of PA (green fluorescence) and β1 integrin (red fluorescence) was monitored microscopically. (Right) The intensities of cytoplasmic PA and β1-integrin signal were quantified by ImageJ analysis as described in Materials and Methods. Data represent mean ± SEM values (n > 30). ***P < 0.001.

