Fig. 5.
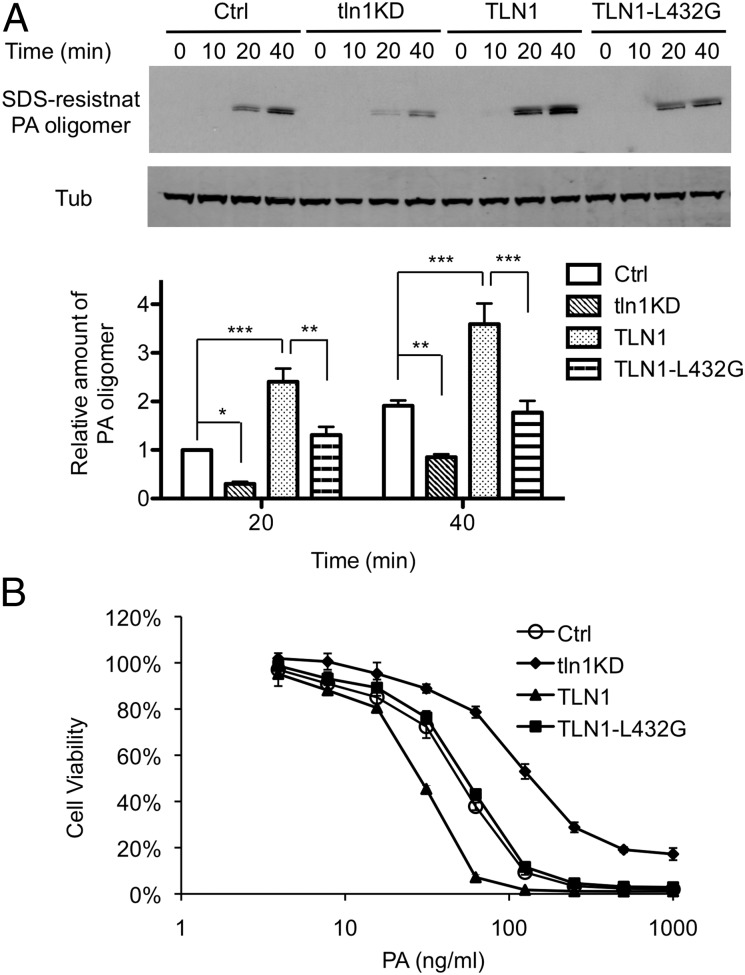
Effect of TLN1 on anthrax toxin internalization and lethality. RAW264.7 cells (Ctrl) were infected with lentivirus expressing TLN1 shRNA (tln1KD) to reduce the expression of TLN1. pEGFP-C1–derived plasmids expressing wild-type TLN1 or mutant TLN1-L432G were introduced by transfection. (A) Kinetics of PA internalization during knockdown or adventitious expression of TLN1. Cells were treated with 1 μg/mL of PA at 4 °C for 1 h and then were shifted to 37 °C for the indicated time. Cell extracts were analyzed by Western blotting using anti-PA and anti-tubulin antibodies. (Upper) A representative Western blot. (Lower) The bar graph shows mean ± SD values of relative amounts of SDS-resistant PA oligomer normalized to tubulin in four independent experiments. Statistical significance was determined by two-way ANOVA. *P < 0.05; **P < 0.01; ***P < 0.001. (B) Cellular susceptibility to PA-LF. Cells were exposed for 4 h to a mixture containing the indicated concentrations of PA and 500 ng/mL LF, and then an MTT assay was performed. The percent of cell viability is presented as mean ± SD. Data are from one representative experiment (n = 3) carried out in triplicate. LD50 values of PA in Ctrl, tln1KD, TLN1, and TLN1-L432G cells are 50.1 ± 3.6, 137.7 ± 1.6, 28.0 ± 0.7, and 54.6 ± 2.1 ng/mL, respectively. P < 0.01 between Ctrl and tln1KD or TLN1 and between TLN1 and TLN1-L432G.

