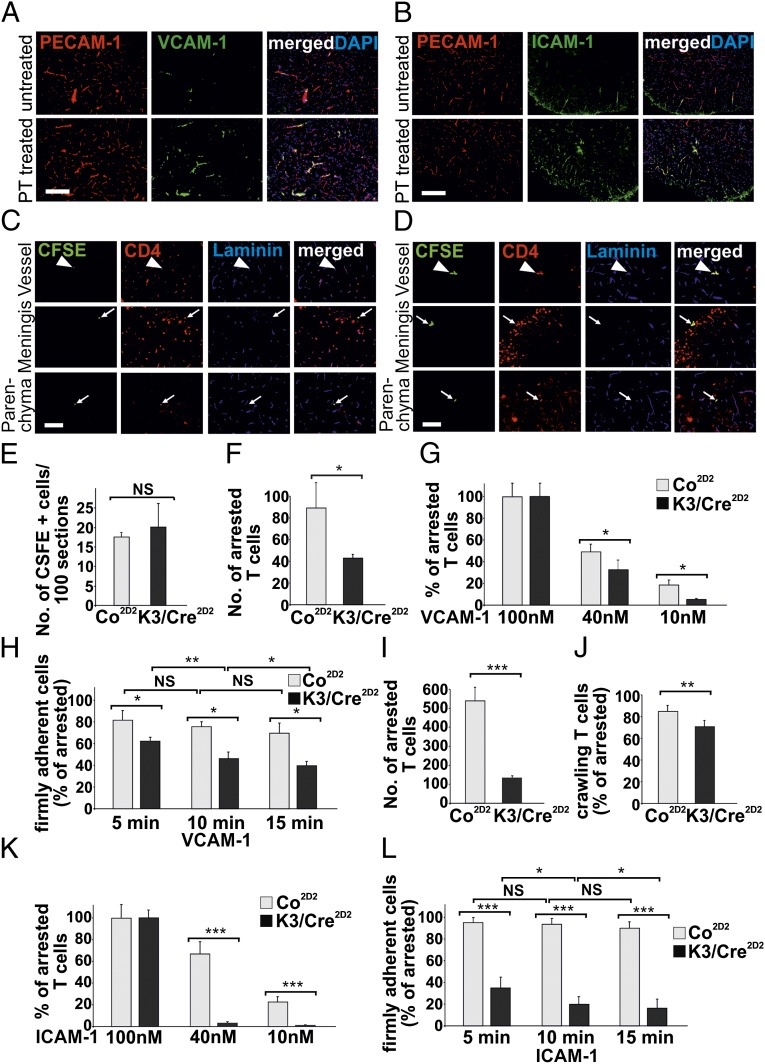
Fig. 3.
Kindlin-3 controls firm adhesion of T cells to VCAM-1 and ICAM-1. (A and B) Spinal cords from untreated and pertussis toxin (PT)-treated animals were stained with anti–VCAM-1 (A) and anti–ICAM-1 (B) Abs (green). Blood vessels were stained with PECAM-1 Ab (red), and nuclei were stained with DAPI (blue). (Scale bar: 200 μm.) (C and D) Autoreactive CFSE+-labeled (green) Co2D2 T cells (C) and K3/Cre2D2 T cells (D) injected into recipient C57BL/6 animals with ongoing aEAE (clinical disease score 2). Sections from lumbar spinal cords were stained with an anti-CD4 Ab (red) to identify infiltrating T lymphocytes. Blood vessels were stained with a pan-laminin Ab (blue). Arrowheads indicate CSFE+ CD4+ T cells within or in close proximity to blood vessels, and arrows indicate peripheral T cells in the parenchyma or meninges. (Scale bar: 100 μm.) (E) Numbers of CFSE+-labeled Co2D2 and K3/Cre2D2 T cells in the lumbar region of the spinal cord at 18 h after transfer into mice with aEAE (clinical disease score 2). (F) Number of T cells arrested on surfaces coated with 100 nM rmVCAM-1 (n = 4 movies for Co; 4 movies for K3/Cre) per FOV. (G) Number of arrested T cells determined on surfaces coated with 100 nM (n = 4; 4), 40 nM (n = 4; 4), or 10 nM (n = 4; 4) rmVCAM-1, expressed as percent of arrested T cells on 100 nM VCAM-1. (H) Numbers of attached T cells determined at 5, 10 and 15 min of laminar flow at 1.5 dyn/cm2, expressed as percent of arrested T cells determined at 15 s after shear increase. (I) Number of T cells arrested on surfaces coated with 100 nM rmICAM-1 (n = 4; 4). (J) Percentage of arrested T cells with crawling activity on 100 nM rmICAM-1 (n = 3; 3). (K) Number of arrested T cells determined on surfaces coated with 100 nM (n = 4; 4), 40 nM (n = 4; 4), and 10 nM (n = 4; 4) rmICAM-1 and expressed as percent of arrested T cells on 100 nM ICAM-1. (L) Percentage of firmly attached T cells on 100 nM (n = 3; 3) rmICAM-1. Numbers of attached T cells were determined at 5, 10, and 15 min of laminar flow at 1.5 dyn/cm2 and expressed as percent of arrested T cells determined at 15 s after shear increase. *P < 0.05; **P < 0.01; ***P < 0.001; NS, not significant. Data are mean ± SD.

