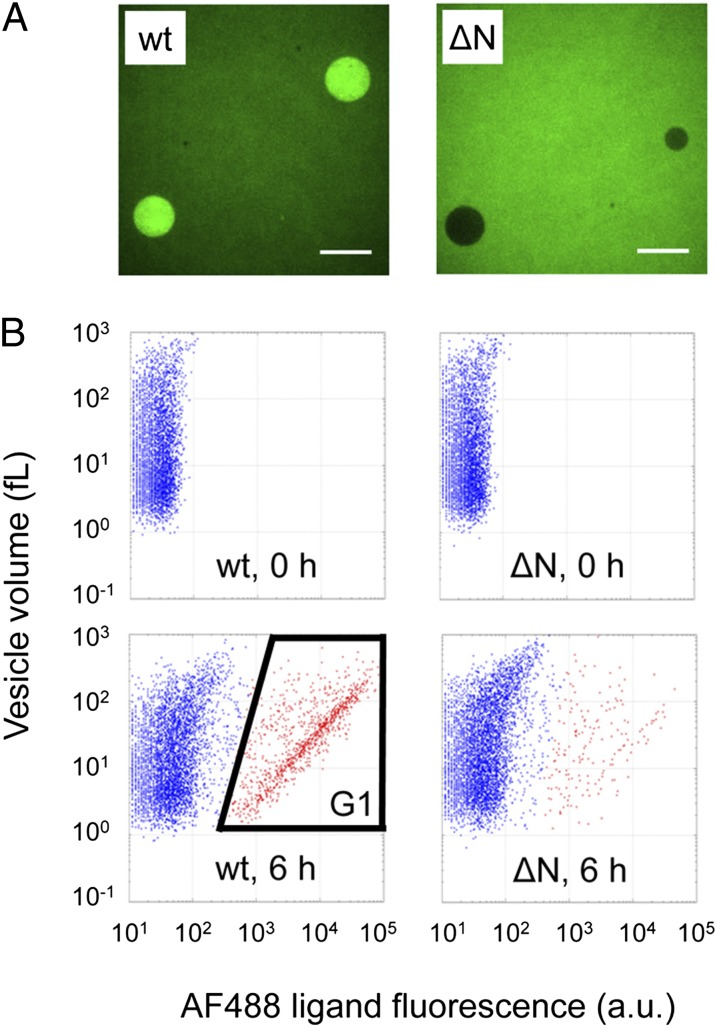
Fig. 2.
Detection of AH activity inside the GUVs. (A) Fluorescence images of the WT (wt) or ΔN mutant (ΔN) gene-encapsulated GUVs. The DNA concentration used for protein synthesis was 5 nM. The concentration of AF488 ligand was 200 nM. (Scale bar = 10 μm.) (B) 2D FACS data of WT or ΔN mutant gene-encapsulated GUVs; 5 pM DNA and 200 nM AF488 ligand were used. The vertical axis shows the aqueous volume of each GUV, and the horizontal axis shows the fluorescence intensity of the HaloTag A488 ligand. GUVs containing WT DNA appeared in the G1 region. GUVs in G1 are plotted in red. The aqueous volume of each vesicle was estimated by encapsulating 1 μM TA647, as described in Materials and Methods. The a.u. represents the raw value of FITC-A obtained by FACS.

