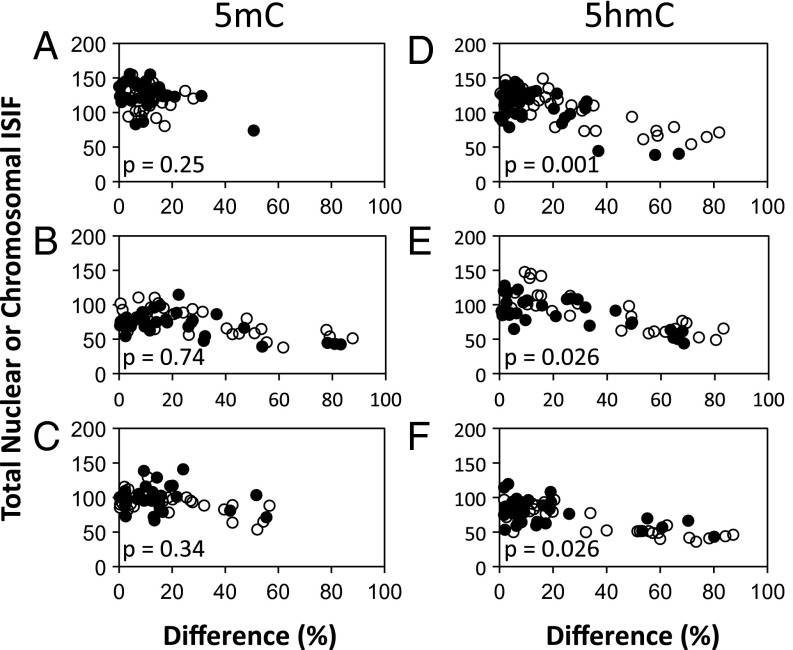
Fig. 2.
Quantitative analysis of the relationships between the patterns of 5mC or 5hmC chromosomal content and their total nuclear or mitotic chromosome content. The fluorescence intensity of individual paired nuclei or segregating chromosome sets, like those presented in Fig. 1, was quantified by digital imaging epifluorescence microscopy. Fluorescence intensity caused by 5mC or 5hmC antibodies in independent experiments was determined for 3C5 mouse hair follicle DSCs. For each analysis, the percent difference in ISIF intensity between paired nuclei or segregating sets of anaphase/telophase mitotic chromosomes (x-axis) is plotted versus the total ISIF intensity of each pair (y-axis). Increasing percent differences indicate an increasing degree of asymmetry in 5mC or 5hmC chromosomal content. (A and D) Data from nuclei of sister pairs. (B and E) Data from nuclei of cytochalasin D-arrested binucleated cells. (C and F) Data from segregating chromosome sets in anaphase/telophase mitotic cells. Open circles represent Xn-free conditions that promote ASR with nonrandom segregation. Filled circles represent Xn-supplemented conditions that promote SSR and random segregation. p, the Kolmogorov–Smirnov probability that the percent differences shown in the Xn-free and Xn-supplemented distributions would occur by chance.

