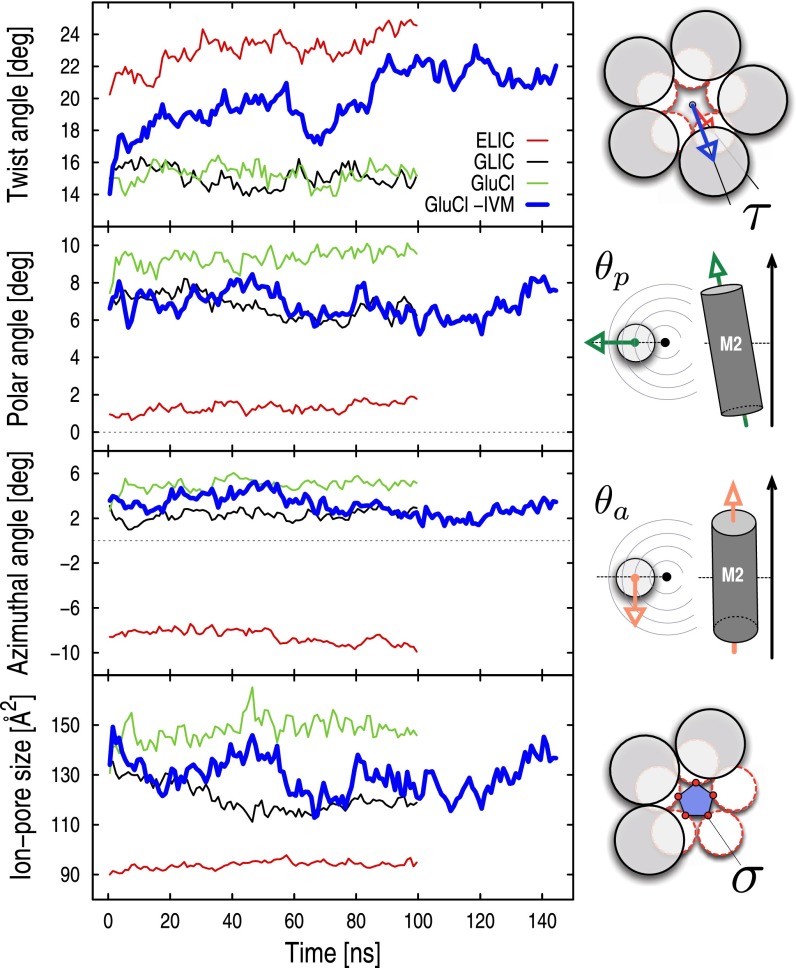
Fig. 2.
Time dependence of the structural/functional observables used for characterizing activation in pLGICs. From top to bottom, the time series of the global twist of the receptor (τ), the polar and azimuthal tilt of the M2 helices  , and the size of the ion pore (σ) are shown for the prokaryotic channels ELIC (red) and GLIC (black), and the eukaryotic GluCl with (green) and without (blue) ivermectin. Shown data points correspond to averages taken over consecutive time windows of 1 ns (i.e., 50 snapshots). On the right-hand side, a schematic representation of the various observables is given.

