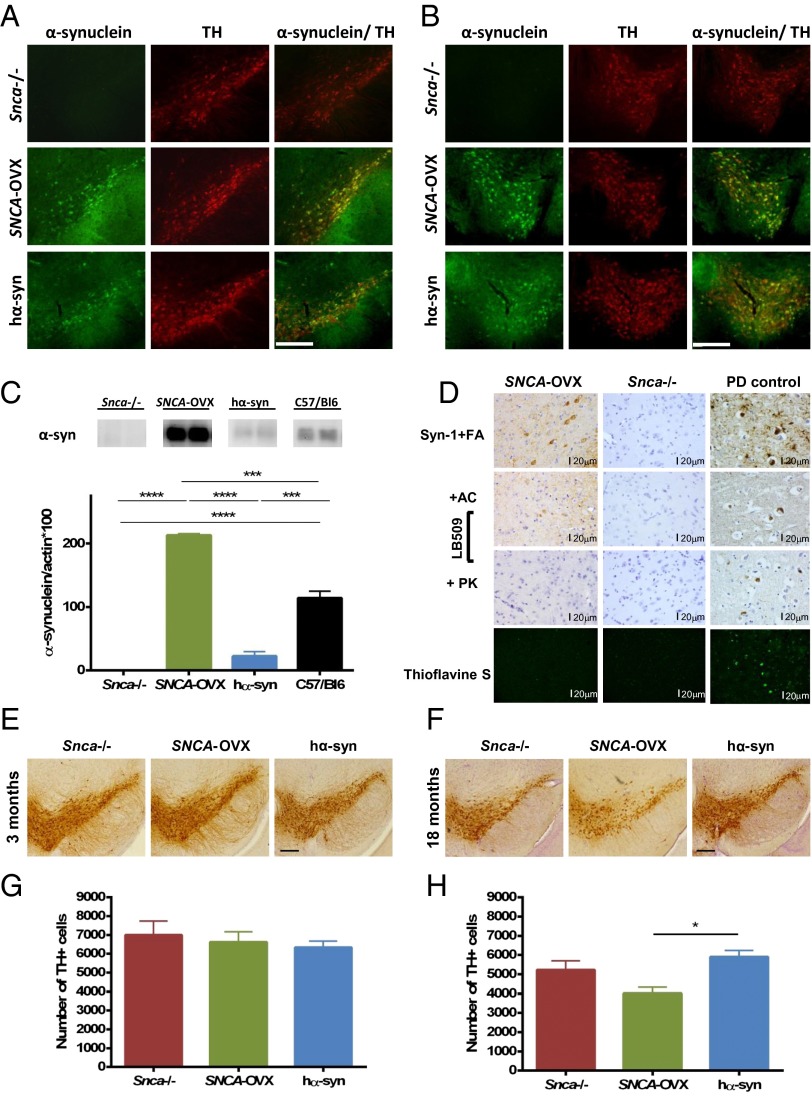
Fig. 1.
Characterization of α-syn transgenic mice. (A and B) Double immunofluorescence labeling for α-syn and TH confirms human α-syn transgene expression in TH-immunoreactive dopamine neurons of the (A) SNc and (B) VTA in 3-mo-old SNCA-OVX and hα-syn animals. (Scale bars, 200 µm.) (C) Quantitative Western analysis of striatal α-syn expression in 3-mo-old SNCA-OVX, hα-syn, Snca−/−, and C57/Bl6 animals reveals that SNCA-OVX animals express the human wild-type SNCA transgene at 1.9-fold higher levels compared with endogenous mouse α-syn protein in C57/Bl6 animals. No α-syn expression was observed in Snca−/− control animals. One-way ANOVA with Bonferroni post hoc analysis; ****P < 0.0001, ***P < 0.001, n = 2–3. (D) Immunohistochemical analysis revealed somatic cytoplasmic α-syn immunostaining in cells of the SNc in 18-mo-old SNCA-OVX mice using the Syn-1 antibody with formic acid (FA) pretreatment. Similar structures were weakly labeled in 18-mo-old SNCA-OVX mice using the LB509 antibody autoclaved (AC) in citric buffer. This staining was abolished when proteinase K (PK) antigen retrieval was applied instead. All of these immunohistochemical stainings were carried out together with control tissue (entorhinal cortex from a PD patient with dementia that shows prominent Lewy body and neuritic pathology). No “amyloid” pathology was detected with thioflavine S in either 18-mo-old SNCA-OVX or Snca−/−, whereas several Lewy bodies and dystrophic neurites were detected in the positive PD control. (Scale bars, 20 μm; magnification: all pictures, 400×.) (E and G) At 3 mo of age, stereological cell counting revealed no differences in the number of TH-immunoreactive neurons in the SNc of SNCA-OVX mice compared with hα-syn and Snca−/− mice. One-way ANOVA: no main effect of genotype: F < 1, P > 0.05, n = 5 per genotype. Data are expressed as the mean ± SEM. Representative images of TH-immunoreactivity in the SNc are shown. (Scale bar, 200 µm.) (F and H) Analysis of 18-mo-old animals revealed a 30% loss of TH-immunoreactive neurons in the SNc of SNCA-OVX mice compared with hα-syn mice. One-way ANOVA with Bonferroni post hoc analysis: main effect of genotype: F(2,12) = 6.3, *P < 0.05, n = 5 per genotype. Data are expressed as the mean ± SEM. Representative images of TH immunoreactivity in the SNc are shown. (Scale bar, 200 µm.)

