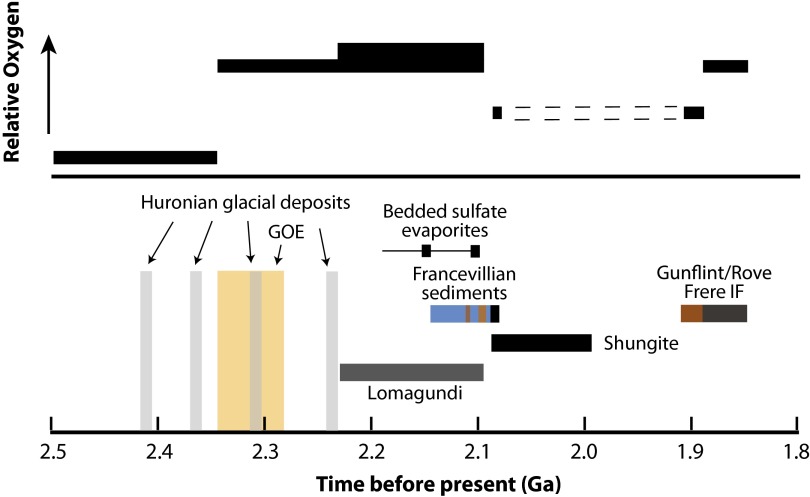
Fig. 3.
(Upper) Reconstruction of relative trends in levels of oxygen based on information given in the text. Dotted line represents a time with little constraint as discussed in the text. (Lower) Outlines the timing of the depositional units used to reconstruct oxygen trends. Also shown are the depositional environment for the Francevillian sediments as shown in Fig. 1 as well as indications of intervals of massive bedded gypsum deposition as presented in refs. 20 and 55. The timing of the Huronian glaciations are after ref. 17, and the GOE after ref. 56. Uncertainties in the dating of the different deposits are represented in the length of the horizontal bars representing the various fields (see Results and Discussion, Ocean and Atmospheric Oxygenation in the Wake of Lomagundi Excursion for details). The chronology of the Francevillian sediments is discussed in the text. Note that the shungite deposits of Fennoscandia have been previously linked with deposition of the FD unit from Gabon (33).

