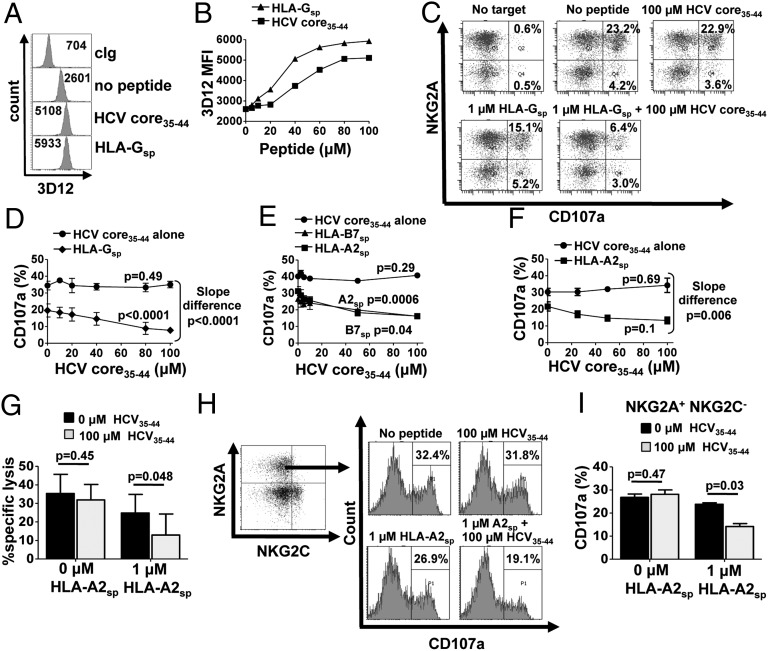
Fig. 1.
HCV core35–44 inhibits NKG2A+ NK cells only in the presence of an MHC class I leader peptide. (A and B) Stabilization of HLA-E on .174 cells, either in the absence of peptide or loaded with 0–100 µM HCV core35–44 or HLA-Gsp, as determined by flow cytometry. The mean fluorescence intensity (MFI) of 3D12 staining is shown in the histograms (A) and is plotted against peptide concentration (B). (C) CD107a assay of NKG2A+ NK cells in response to 0–100 µM HCVcore35–44 or HLA-Gsp alone or in combination. Dot plots are gated on CD3− CD56+ CD158b− lymphocytes. (D) CD3− CD56+ NKG2A+ CD158b− NK cell degranulation in response to increasing concentrations of HCV core35–44 in the presence or absence of 1 µM HLA-Gsp. Data shown are the mean ± SEM of three independent experiments. (E and F) CD3− CD56+ NGK2A+ CD158b− NK cell degranulation to .174 cells loaded with HCV core35–44 in the presence or absence of HLA-A2sp or HLA-B7sp for a healthy donor (E) and three HCV donors (F). (G) Cytotoxicity assay of sorted NKG2A+ NK cells using .174 targets incubated with the indicated peptides at an E:T ratio of 10:1. Data shown are the mean and SEM of three independent experiments from three different donors. (H and I) CD107a assay gating on NKG2A+ NKG2C− NK cells stimulated with .174 cells loaded with the indicated peptides. One representative experiment is shown in H, and the mean + SEM from three independent experiments is shown in I. Slope difference P values in D, E, and F were calculated using linear regression comparing the difference the between the two lines. All other P values were calculated using one-way ANOVA.

