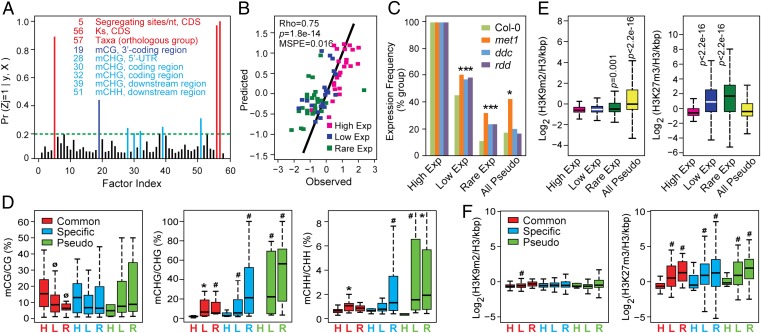
Fig. 4.
Quantitative analyses of the impact of genomic and epigenomic variations on FBX gene expression. (A) PP of a nonzero effect of 58 gene parameters on FBX gene expression. See SI Appendix, Fig. S5 for the parameter descriptions. The parameters highlighted with red, dark blue, and light blue have a PP > 0.2. (B) Spearman rank correlation between the predicted mean expression values of FBX genes from the test sample containing 25 representatives from the High, Low, and Rare Exp groups with those observed within NASCArrays. Logarithmic transformations fit the data to an approximately normal distribution for Bayesian analysis. (C) Expression frequency of High, Low, and Rare FBX genes, as well as the full set of Arabidopsis pseudogenes in three methylation defective mutants (met1, ddc, rdd) compared with Col-0. (D) Enrichment of coding sequence DNA methylation at CG, CHG, and CHH contexts within the Common, Lineage-Specific, and Pseudo FBX groups further subdivided based on their expression levels (High, Low, and Rare Exp). (E) Occupancy of H3K9m2 (Left) and H3K27m3 (Right) in the coding regions of High, Low, and Rare FBX genes, and all Arabidopsis pseudogenes in the Col-0 accession. (F) Occupancy of H3K9m2 and H3K27m3 within the coding regions of Common, Specific, and Pseudo FBX genes further subdivided based on their expression levels (High, Low, and Rare Exp). See Fig. 1 for description of box plots. P values in C were calculated by Fisher’s exact test, and P values in D–F were calculated by Wilcoxon rank test. ØP(Low/Rare < High) < 0.05. *P(Low/Rare > High) < 0.05. #P(Low/Rare > High) < 0.01.

