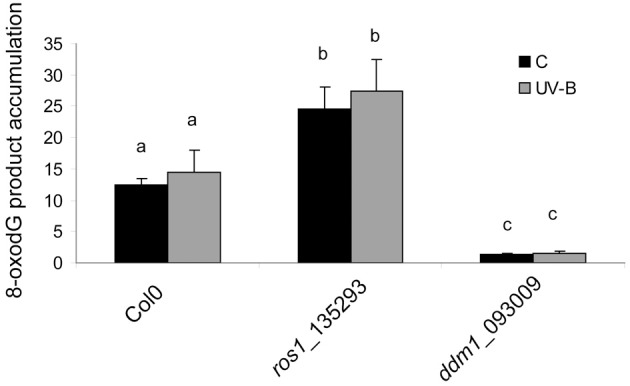
Figure 5.

8-oxodG levels in the DNA of Col0, ros1 and ddm1 arabidopsis plants. Plants were assayed under control conditions (C) and after a 4 h UV-B treatment (UV-B). Results represent the average ± S.E.M. of six independent biological replicates. Different letters denote statistical differences applying ANOVA tests using Sigma Stat 3.1.
