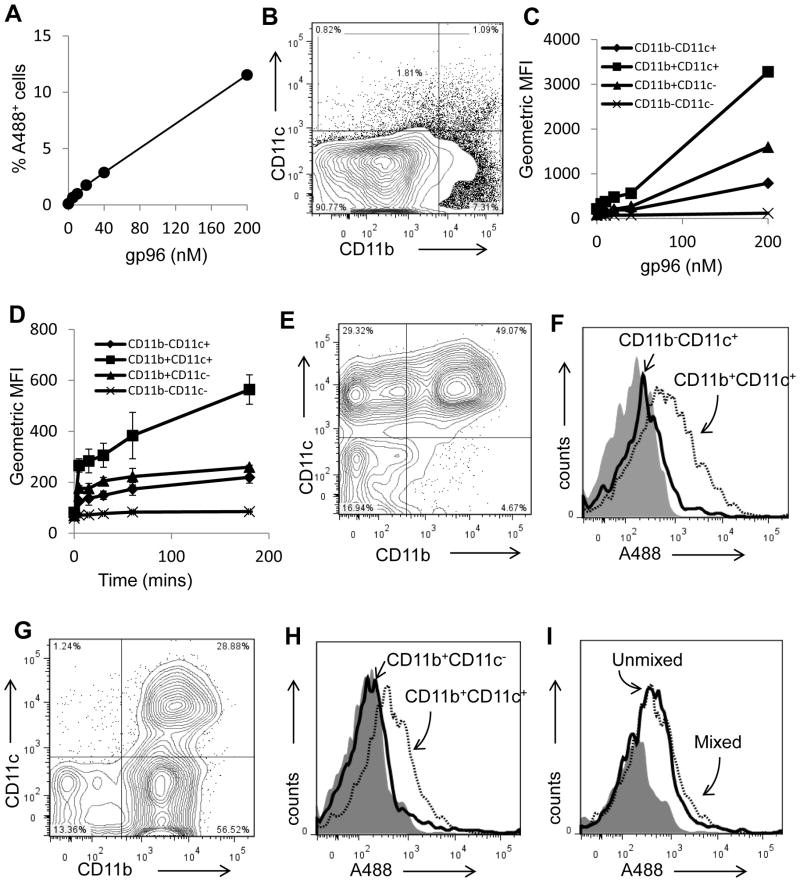
Figure 6. Differential capacities of APC subsets to endocytose gp96.
(A) Isolated lymph node cells were incubated with titrated doses of gp96A488. Cells were analyzed by flow cytometry for A488 positivity and expressed as a percentage of the total population. (B) The lymph node cells were gated into populations expressing CD11c+ and/or CD11b+. (C) Following incubation of lymph node cells with varying doses of gp96A488, these populations were analyzed for endocytosis of gp96A488. Experiments were performed in duplicates. (D) Endocytosis of gp96A488 by the indicated populations was tested by incubating lymph node cells with 20 nM gp96A488 for the indicated time. Experiments were performed in duplicates. (E) Competitive endocytosis was examined by mixing purified populations of CD11b−CD11c+ and CD11b+CD11c+ cells with sub-saturation amount of gp96A488. A representative FACS plot of the cell mixture is shown. (F) An analyses of the two populations of cells from (E), for A488 positivity are presented as histograms. (G) Competitive endocytosis was examined by mixing purified populations of CD11b+CD11c− and CD11b+CD11c+ cells in the presence of sub-saturation amount of gp96A488 cells. A representative FACS plot of the cell mixture is shown. (H) An analysis of the two populations of cells from (G), for A488 positivity are presented as histograms. (I) The endocytosis of sub-saturating amounts of gp96A488 by CD11b+CD11c+ cells, in the presence or absence of CD11b+ cells, is shown. Data (A, C, D) are represented as mean +/− SEM.

