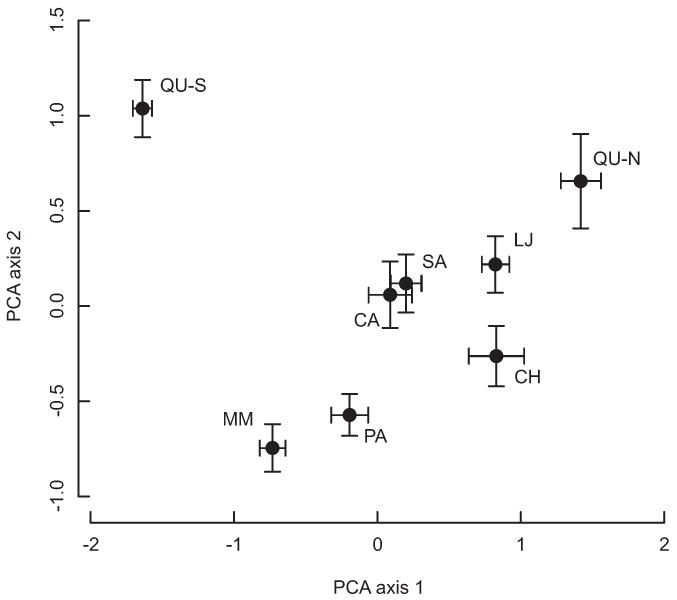
FIG. 2.

A principal components analysis (PCA) of the microsatellite data from each sampled district. The dots represent the centroid location of the individuals from each district along with the standard error on the estimate of the centroid. All districts occupy a unique location on the PCA plot except Sachaca and Cayma, which are also the pair of communities that have a nonsignificant FST (Table 2). Despite being geographically distant, the La Joya district occupies a similar location in PCA space to the other districts. The Quequeña district is split into two distinct groups based on sampling location with the northern location similar to the other districts while southern location is distinct. The first two principal component axes explain 42.2% of the total genetic variation.
