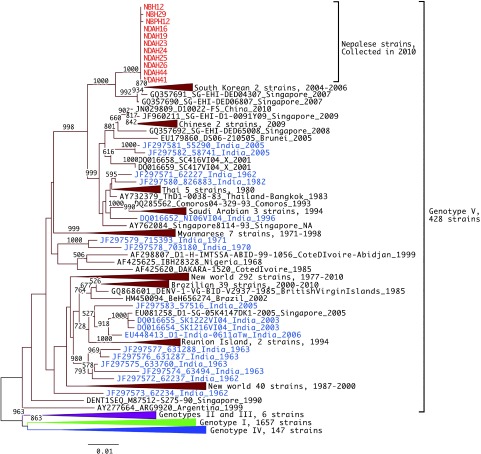
Fig. 3.
Phylogenetic tree of DENV-1 E region. Representative analysis of E region, 1,485 bps, 2,238 strains. Red and blue indicate Nepalese strains and Indian strains, respectively. The tree was constructed after 1,000 replicates of bootstrap analysis using neighbor joining method. Bootstrap values (%) greater than 50% are shown above branches. Labels of strains conform to the following format: (GenBank accession nos)_(Strain name)_(Country-region)_(Year of isolation). “NA” means that the information is not available.

