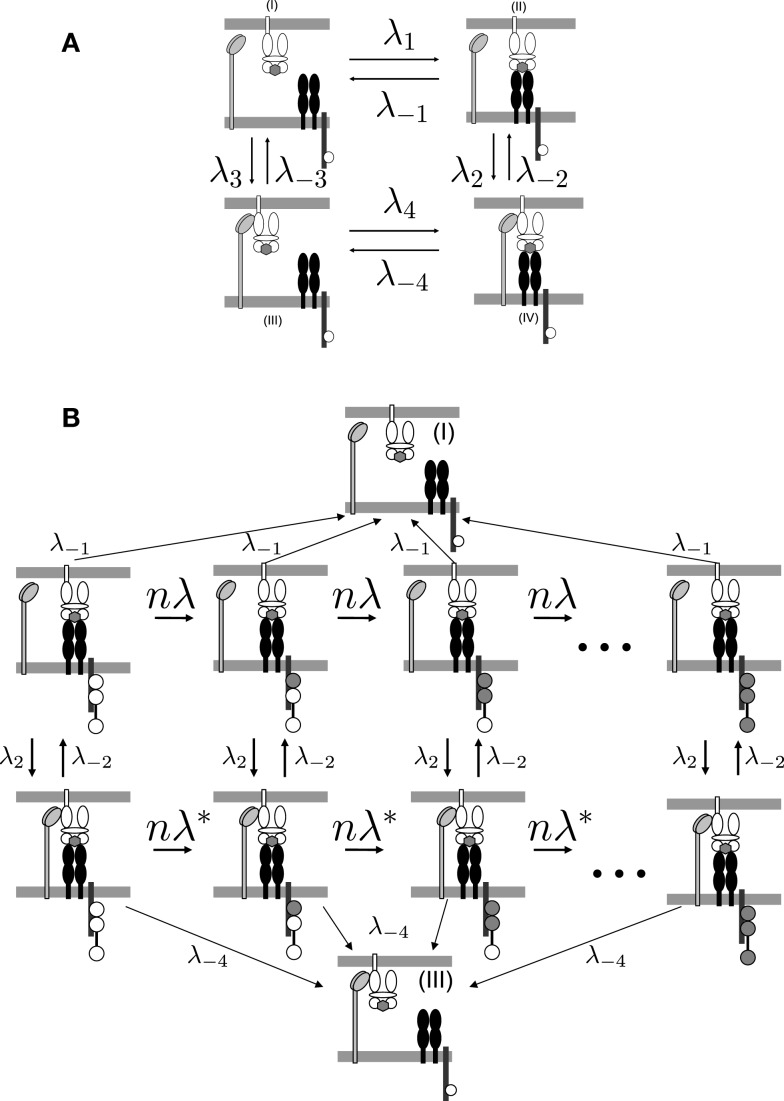
Figure 1.
TCR/pMHCI/CD8 interactions represented in the model. (A) Kinetics of TCR/pMHCI/CD8 complex formation. TCRs and CD8s are located on the T-cell side and pMHCIs on the APC side. Four possible states are shown: in (I) and (II), pMHCI is not bound to CD8 whereas in (III) and (IV), pMHCI is bound to CD8; in (I) and (III), pMHCI is not bound to TCR/CD3 whereas in (II) and (IV), pMHCI is bound to TCR/CD3. Transition rates between these four states are indicated with forward rates labeled as λi and backward rates labeled as λ−i (where i = 1, 2, 3, 4). The white circles in the tails of the TCR/CD3 complex represent the ITAMs, which are present on the cytoplasmic tails of the γ, δ, the two ϵ, and the two ζ polypeptide chains of the CD3 complex; only one such tail is indicated here, for clarity. There are n such ITAMs, with only three shown here for the sake of clarity. This part of the kinetic scheme is assumed to be in equilibrium. (B) The TCR/pMHCI bound states (II) and (IV) are further subdivided into n states each depending on the number of phosphorylated ITAMs, resulting in a Markov chain. The triggered states are the right-most ones where all n ITAMs have been phosphorylated (indicated as filled-in circles). At each state a reversal (at rate λ−1 or λ−4) to the unbound states (I) or (III), respectively, can occur. Transitions between the sequences occur at rates λ2 and λ−2. Left-to-right transitions within the sequences correspond to ITAM phosphorylation by kinases such as p56lck and ZAP-70, at rate nλ = n/TR in the sequence with CD8 unbound and at rate in the chain with CD8 bound. The Markov chain serves to calculate the TCR triggering probability and is not assumed to be in equilibrium.

