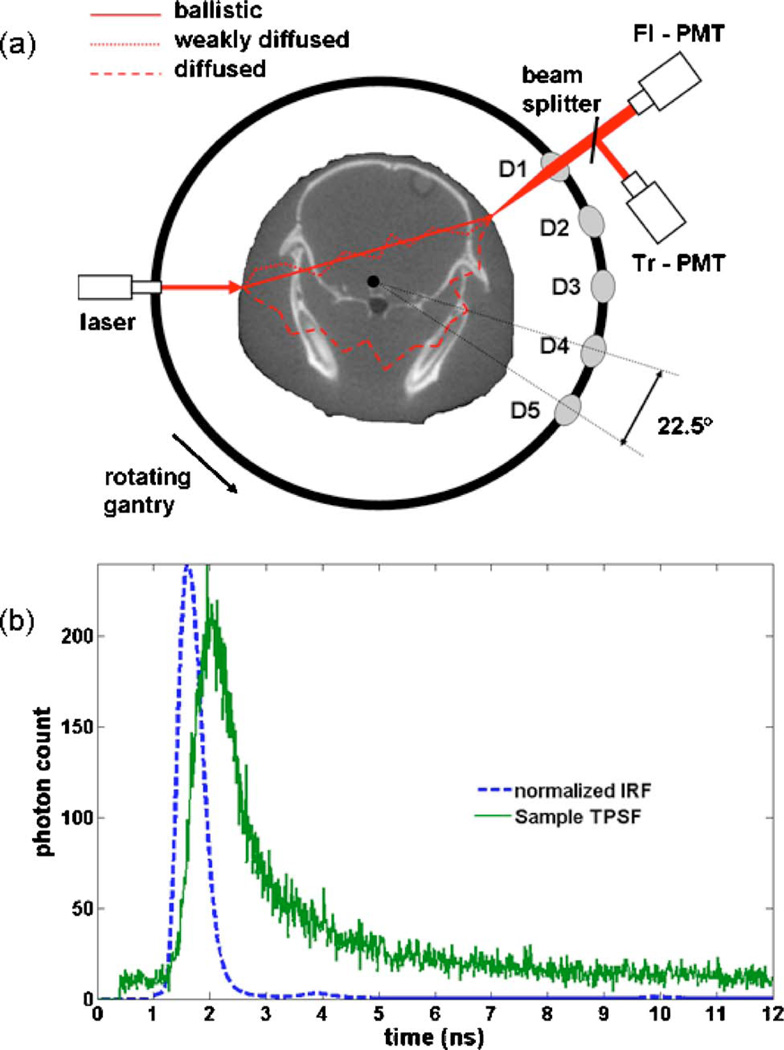
Fig. 1.
(Color online) Schematic representation of the optical instrument. Shown is a single excitation source position and the five channels. Diffuse light signals at the surface of the specimen are collected using focalized detection. The detected signals are then separated and directed to two sets of PMTs dedicated to fluorescence and excitation signals at each fiber channel. This detection geometry is that used for the simulations presented in this paper. (b) Impulse-response-function (IRF) and sample fluorescence time-resolved signal acquired for one of the channels.

