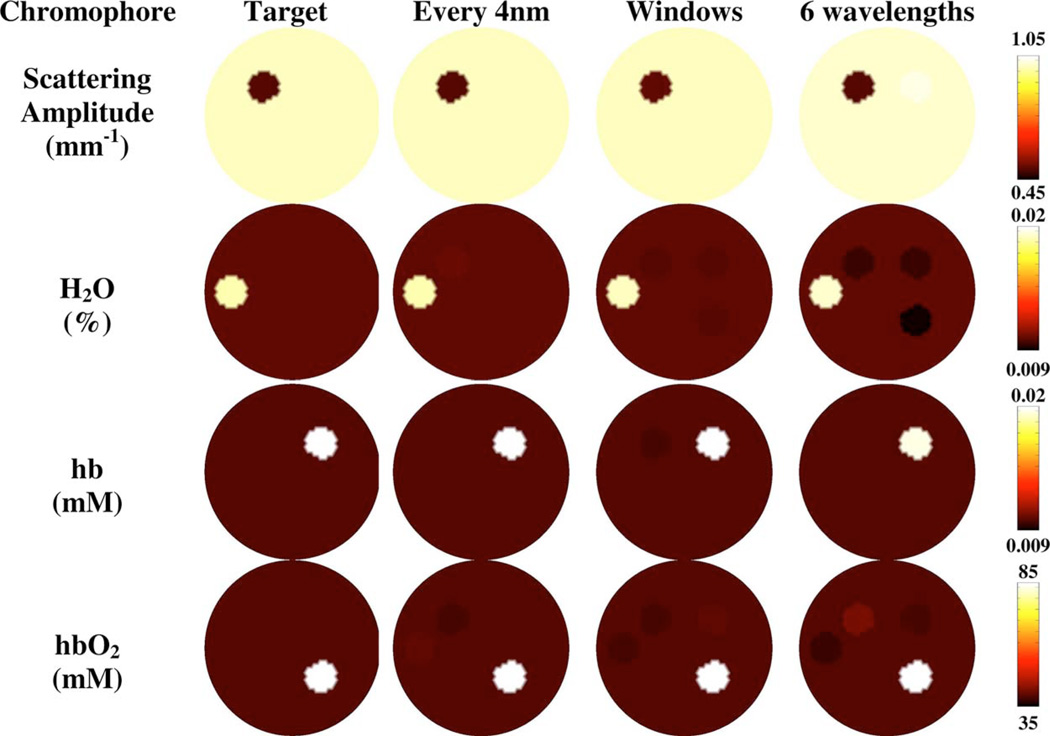
Fig. 3.
Region-based spectral reconstruction of scattering amplitude, water, deoxyhemoglobin, and oxyhemoglobin using three different wavelength selections; the full spectrum (650 to 930 nm), denoted by every 4 nm, windows of wavelengths sampled from the full spectrum, and a set of six wavelengths derived from a typical measurement system. The cw data has 5% added noise.

