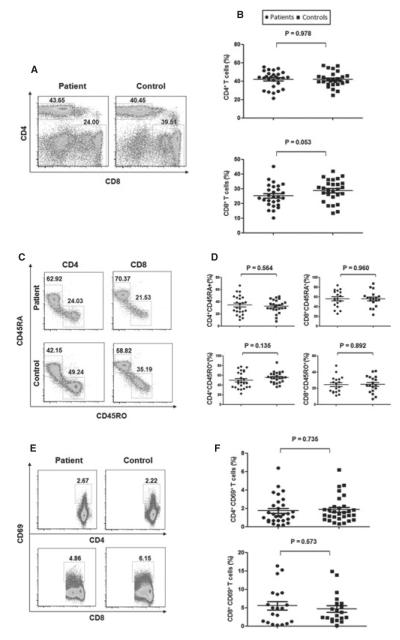
Figure 1.
Distribution of conventional T cells in the peripheral blood. (A) Flow cytometry analysis of CD4+ and CD8+ T cells in peripheral blood mononuclear cells (PBMC) from non-segmental vitiligo (NSV) patients and healthy controls. (B) Summary plots showing individual results of the frequency of CD4+ and CD8+ T cells described. (C) Flow cytometry analysis of memory (CD45RO+) and naïve (CD45RA+) CD4+ and CD8+ T cells in PBMCs. (D) Summary plots showing individual results of the frequency of CD45RA+ and CD45RO+ CD4+ and CD8+ T cells in NSV patients versus healthy controls. (E) Representative FACS dot plots for CD69 expression in CD4+ and CD8+ T cells. (F) Summary plots showing individual results of the frequency of CD69+ CD4+ T cells and CD69+ CD8+ T cells in NSV patients versus healthy controls.

