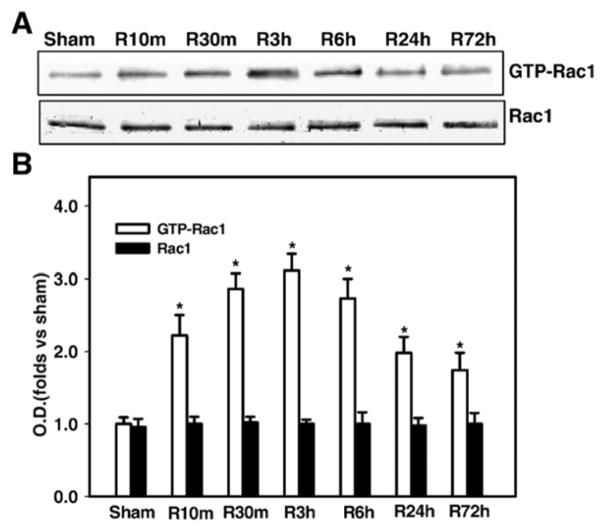
Fig. 1. Time course of the activation of Rac1 in the hippocampal CA1 region after global cerebral ischemia.
(A) Homogenates from the CA1 region at various time points of reperfusion (sham, 10 min, 30 min, 3h, 6 h, 24 h and 72 h) were subjected to Rac1 activation assay. (B) Graphical depiction of results from all animals. Corresponding bands were scanned and the optical density (OD) was represented as folds versus sham control. Data are expressed as means ± SD from four independent animals (n = 4), *p < 0.05 versus sham control.

