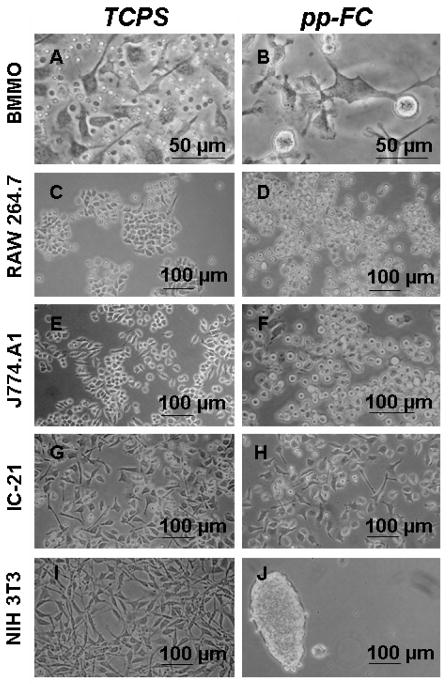
Figure 3.
Phase contrast photomicrographs of live cells on control (TCPS) and pp-FC surfaces for primary-derived cells (BMMO) and secondary-derived immortalized cell lines of (monocyte-) macrophage (RAW 264.7, J774A.1, IC-21) and fibroblast (NIH 3T3) origin. Cell seeding density varied, as described in Materials and Methods. Cultures depicted represent 2–4 days post-seeding on each surface and represent the typical sub-confluent growth pattern observed for each cell type (except J). Images are representative of multiple fields (≥ 3) and multiple replicates (≥ 2) for each test condition.

