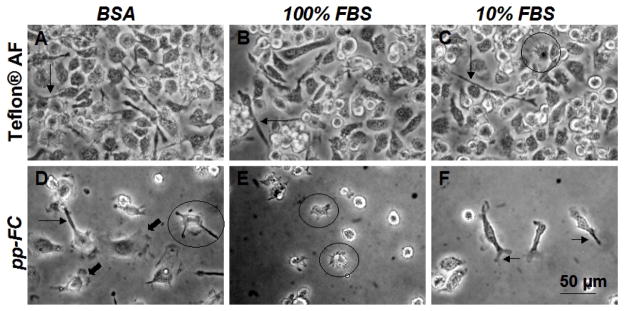
Figure 5.

Phase contrast photomicrographs of live BMMO (Day 8 in culture) on FC surfaces exposed to preconditioning treatments as indicated. Cells were seeded at densities of 600 cells/mm 2 on Teflon® AF and 1500 cells/mm2 on pp-FC. Circles indicate astral morphology (C–E), arrows indicate filopodia (A–D, F) and bold arrows indicate membrane ruffling (D). Scale bar shown in F is relevant for all images. Images are representative of multiple fields (≥ 3) and multiple replicates (≥ 2) for each test condition.
