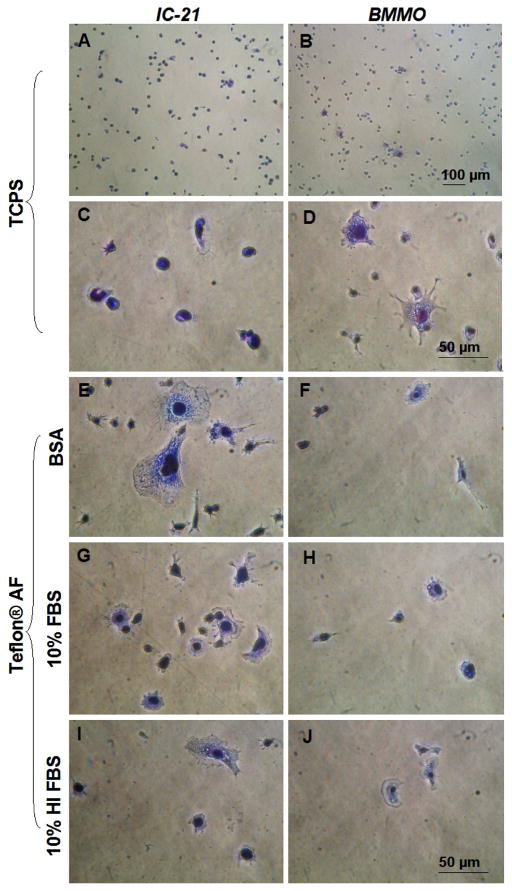
Figure 7.
Phase contrast photomicrographs of IC-21 and BMMO cells on control (TCPS) and Teflon® AF surfaces with preconditioning treatments (Teflon® AF only) as indicated. Cells were seeded at a density of 500 cells/mm2, fixed and stained after one hour. Scale bars in D and J are equivalent, and relative for all panels except A and B. Images are representative of multiple fields (≥ 3) and multiple replicates (≥ 2) for each test condition.

