
Figure 2.
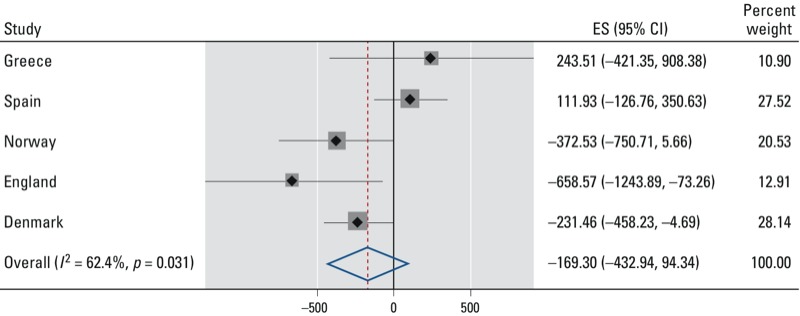
Change in birth weight (g) associated with the bulky DNA adduct levels in cord blood (per 108 nt) by country. Country-specific effect estimates (ES) and their 95% CIs as well as the meta-analyses combined effect estimates (random effect of country), which correspond to the change in birth weight for the highest relative to the lowest tertile of cord blood bulky DNA adduct levels further adjusted as described in Table 2 (n = 409). Black diamonds indicate ESs; gray squares are proportional to the country-specific weights used in the meta-analyses, and the associated 95% CIs are shown as horizontal black lines. The summary ES, which corresponds to the change in birth weight (g), is indicated with a red dashed vertical line and blue diamond, and the associated 95% CIs are indicated by the lateral tips of the diamond. The solid vertical black line indicates no change in birth weight.