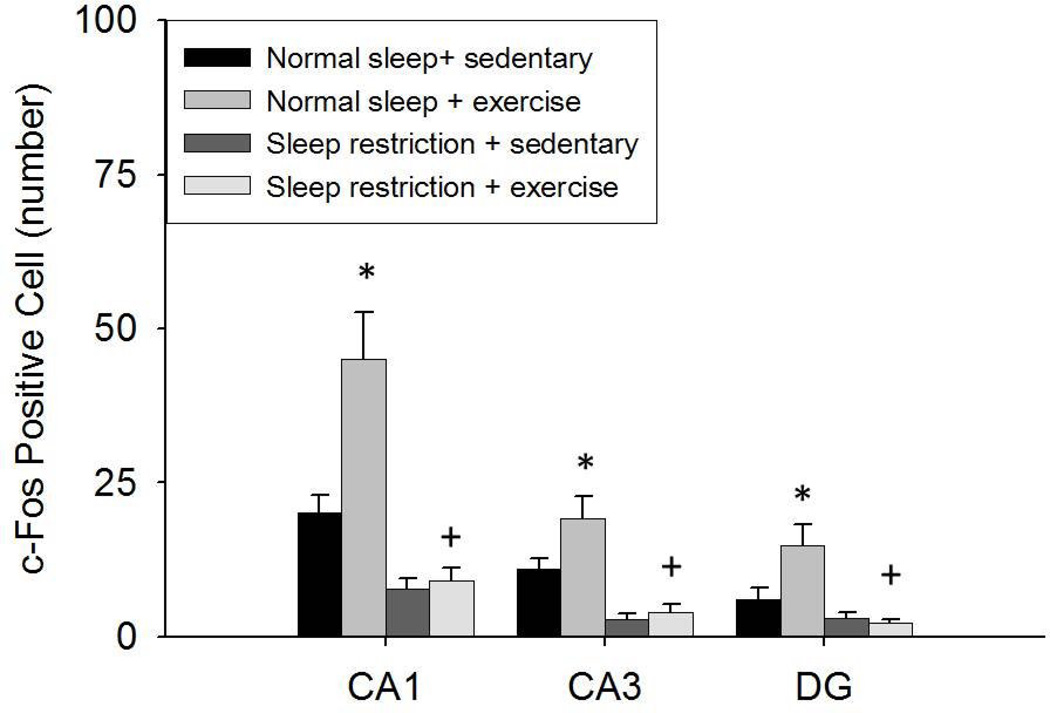
Fig 3.
The number (Mean ± SE) of c-Fos positive cells in the CA1, CA3, and DG areas of the hippocampus after the 11-week treatments. A main effect was found for sleep restriction attenuating c-Fos positive cells was found during both sedentary and exercise conditions. A main effect was found for exercise enhancing c-Fos positive cells. However, exercise enhanced c-Fos positive cells under normal sleeping conditions but not sleep restriction conditions. (*) indicates differences between experimental group and normal sleeping sedentary controls. (+) indicates differences between normal sleeping exercise and sleep restriction exercise groups. Significant differences were set at p < 0.05.

