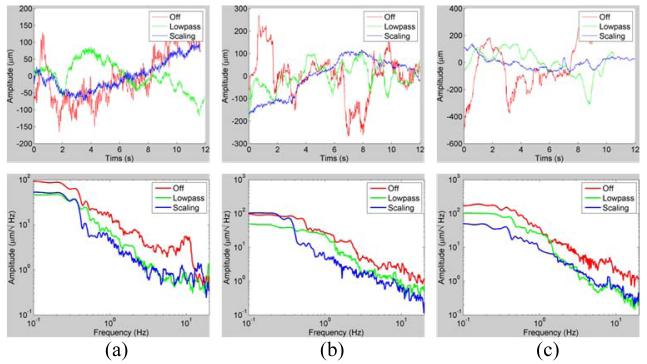
Figure 6.
Results of OCT scanned profiles (top) and power spectrogram (bottom). (a) A-scans during hold-still task in the air. (b) A-scans during hold-still task in the live rabbit eye. (c) M-scans, manually scanning a line of interest in the live rabbit eye. In the A-scans, the profiles are the axial deviation of the tip.

