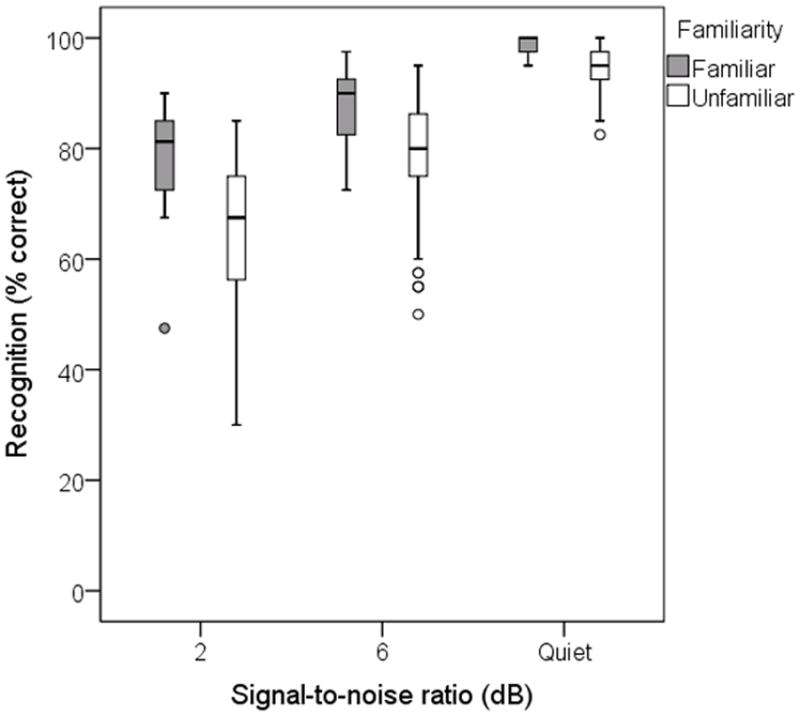
Figure 1.

Speech recognition as a function of signal-to-noise ratio. In each case, the background noise was a broad-band noise shaped to the spectrum of the test sentences. Scores for the familiar talkers are shown by the filled boxes and scores for the unfamiliar talkers by the unfilled boxes. The ends of the box indicate the quartile values and the bar indicates the sample median. The whiskers extend to 1.5 times the height of the box or, if no case/row has a value in that range, to the minimum or maximum values. Outliers greater than 1.5 times the box height are plotted as open circles.
