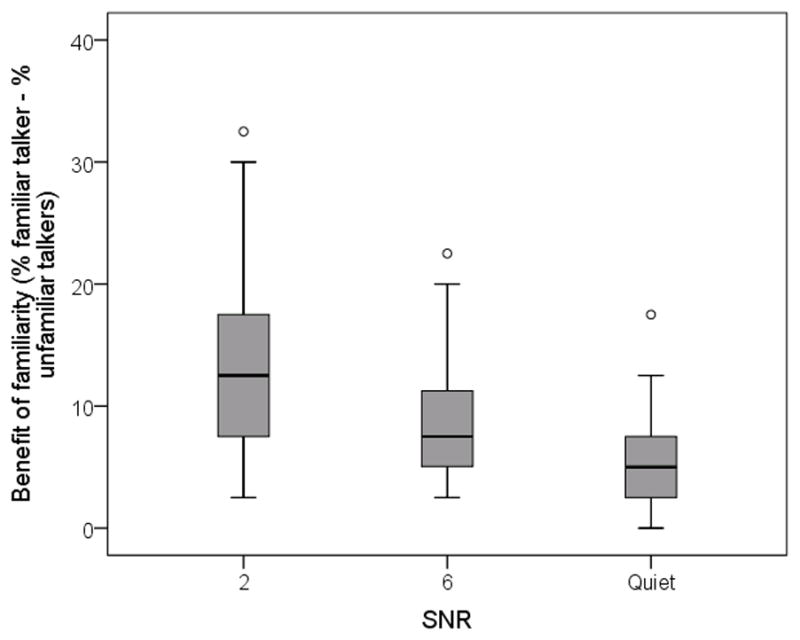
Figure 3.

Familiarity benefit, calculated as the difference between the familiar and unfamiliar talker for each listener, as a function of signal-to-noise ratio. Outliers who fall more than 1.5 box lengths from the median are plotted as open circles.
