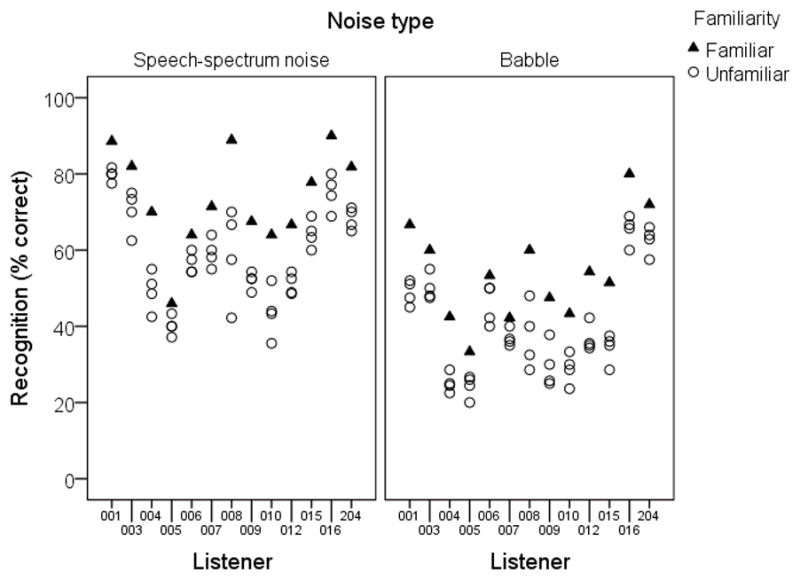
Figure 5.

Speech-recognition scores for individual listeners. Each data point represents a score for a different talker, with the familiar talkers plotted as filled triangles and the unfamiliar talkers plotted as open circles. Each listener heard one familiar and four unfamiliar talkers, but for some listeners cases identical unfamiliar-talker scores are overlaid on the plot. Panels show the two noise types from Experiment 2.
