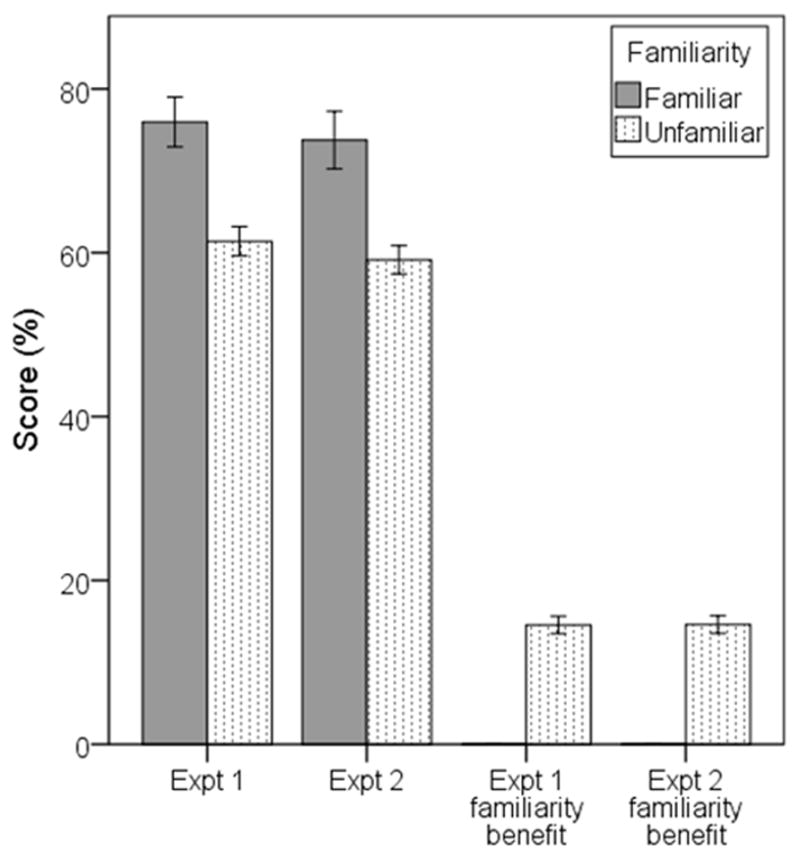
Figure 6.

Comparison of speech-recognition scores with +2 dB of speech-spectrum noise across Experiments 1 and 2. The two left bars show absolute scores. The two right bars show familiarity benefit calculated as the difference between the familiar and each unfamiliar talker. Error bars show +/− one standard error about the mean.
