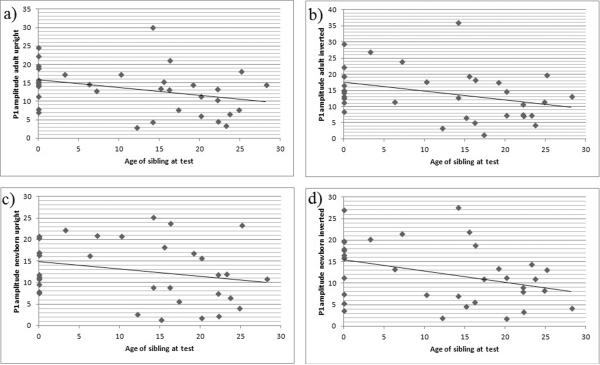
Figure 3.
Scatterplots for the relation of P1 amplitude and age of sibling at test in the complete group of participants (n = 35). The x-axis represents age of sibling at test in months, the y-axis P1 amplitude in microvolts (μV) in response to a) adult upright, b) adult inverted, c) newborn upright, d) newborn inverted faces.

