Figure 6.

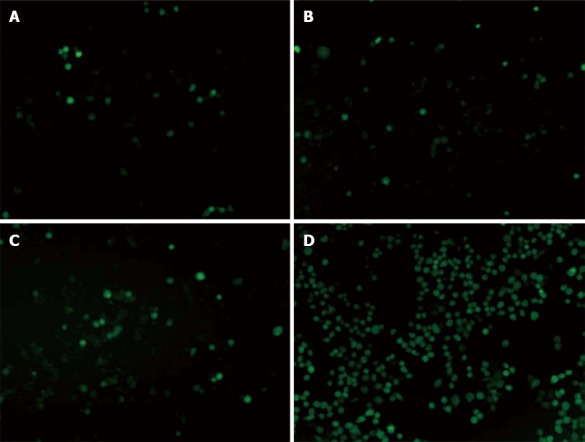
Number of cells producing reactive oxygen species after treated separately. A: Control group; B: Light group; C: Quantum dots-arginine-glycine-aspartic acid group; D: Photodynamic therapy group.

Number of cells producing reactive oxygen species after treated separately. A: Control group; B: Light group; C: Quantum dots-arginine-glycine-aspartic acid group; D: Photodynamic therapy group.