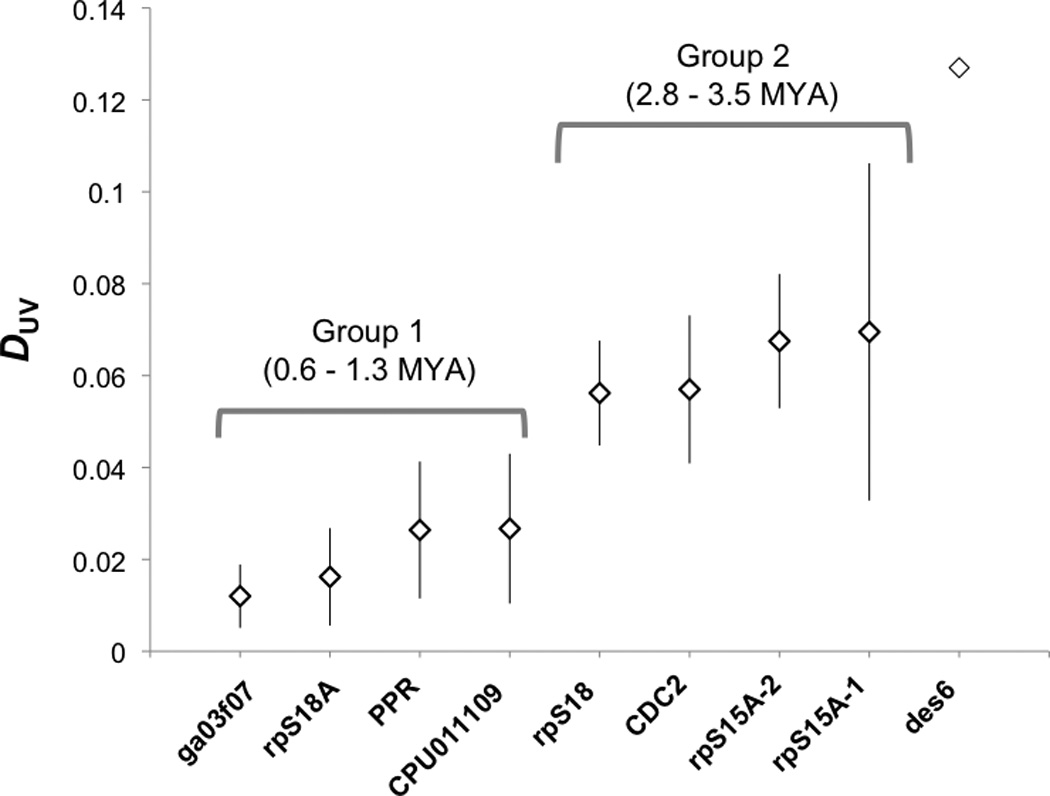
Figure 3.

A plot of average pairwise distance (DUV) between the U and V alleles for each sex-linked locus, showing four proposed evolutionary strata on the sex chromosomes, with vertical lines showing the 95% confidence interval generated by simulations. The des6 locus (far right, from McDaniel et al. 2007) is shown for comparison.
