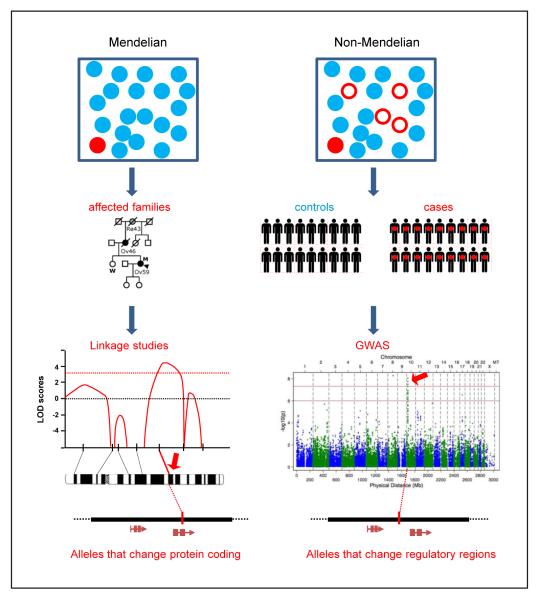
Fig. 1.
Different strategies to identify predisposition loci. Overall strategies to identify loci in Mendelian and in complex (non-Mendelian) diseases. In Mendelian diseases, individuals carrying high penetrance variants that confer risk (red circles) tend to express the disease phenotype (red filled circles) but are rare in the population. In complex diseases, individuals carrying common risk variants (red circles) tend to have low penetrance and many carriers will not manifest the disease phenotype (open red circles). Mendelian diseases can be investigated with family-based linkage studies and risk loci (red arrow) are positionally identified [typically a logarithm of odds (LOD) score >3; dashed red line]. Complex diseases can be investigated with (genome-wide) association studies and risk loci (red arrow) are positionally identified (typically P ≤ 5 × 10⁻⁸).

